
When working with Jira, we need the system to provide reports to measure our work since a lot of information is distributed among several tasks and projects. That's why we will show four different solutions from the Atlassian Marketplace that will help you create customized solutions to report on Jira dashboards for multiple projects.
Using Jira to manage software development or just to track day-to-day tasks can be overwhelming. If you're not controlling this information, and if you need to continuously apply improvements within the processes and/or in the decision-making process, it's important to remember the following quote:
If you can’t measure it, you can’t improve it.
- Peter Drucker.
And here's when the following options will allow you to create useful Jira Dashboards to track multiple projects, besides, in our blog and resources page, you'll find related content when creating reports in Jira for projects, mostly with Projectrak:
|
|
It is worth noticing there's a variety of solutions to improve reporting in Jira and create useful Jira dashboards for multiple projects, and you can find them from different apps in the Atlassian Marketplace; that's why, this time, we'll review some of these solutions that, together with Projectrak, will enhance the tracking of projects in Jira.
Check the Atlassian Community reporting app demos for the Apptoberfest here >>
Although it has been in the Marketplace for over a year, this app quickly carved a niche within many customers' facilities due to its simplicity. This app takes Jira reports to another level without a BI (Business Intelligence) tool's complexity. This app is available for both Cloud and Data Center.
 Do you want to try this app? Pass by their website and directly work with it at an interactive playground.
Old Street Solutions, the creators of this app, launched a version integrated with Projectrak, which will enhance users’ capacity to track projects through the reports provided by Custom Charts:
To promote this integration, we prepared a Co-Hosted Webinar by the end of last year. This was the time for Custom Charts, Projectrak, and Power Suite, and it was part of a series of webinars showcasing different extensions for Atlassian tools.
Check and like the Projectrak Apptoberfest demo in the Atlassian Community >>
Before playing the video, be aware that we previously created a field in Projectrak called Project Status, which we have mapped into a Jira issue custom field, as seen below:
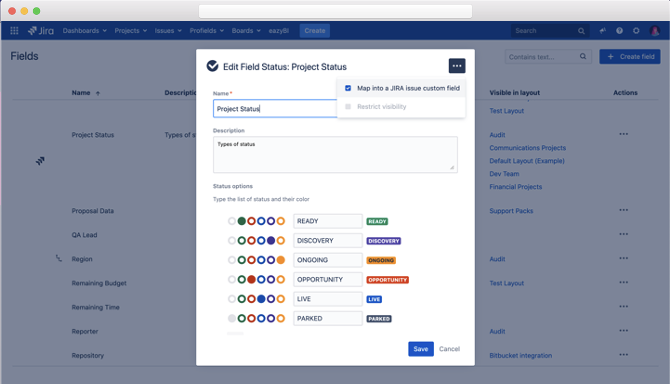
How to create a project field, Status field type with Projectrak? As simple as seen above.
This is the first step to organize better your Jira projects.
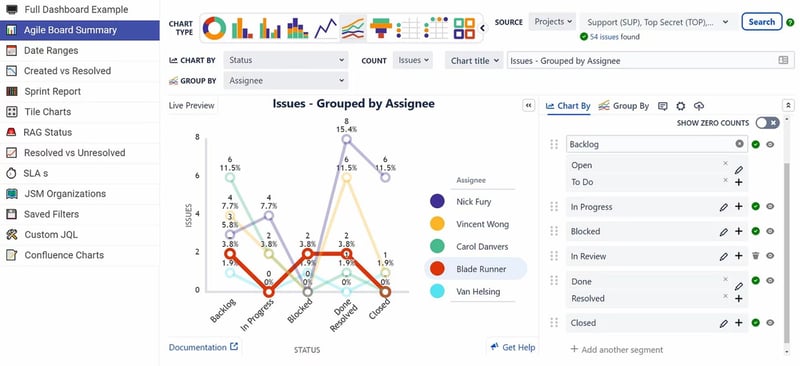
Once the project field has been created and has some projects with issues within, and its project values are updated to different statuses, it's possible to get the reports from projects without further configuration with Custom Charts. This app recognizes the fields created with Projectrak and adds the information to the graph. This feature, together with the new option they have incorporated of counting by projects, allows users to have different reports in which the information of the projects and the issues are crossed.
Watch the following video clip, which explains the integration of Projectrak and Custom Charts for Jira:
From the Custom Charts team, Tom Harris explains how the integration with Projectrak (formerly Profields) works.
Rich Filters is only available for Data Centers, and it's one of those apps that is easy to recommend, given its contribution to controlling environments through Jira dashboards. Very useful for support teams, for example.
The main benefit of Rich Filters for Jira is that it allows users to filter right from the Jira dashboards, completely reloading the dashboard based on the selected criteria. This makes it a very handy app, allowing users to incorporate new gadgets into the dashboard.
To get the results you need, you must configure the app to define which criteria (fields) will be used in each filter and its behaviors. This app's other advantage is that it is easy to reuse once this configuration is completed.
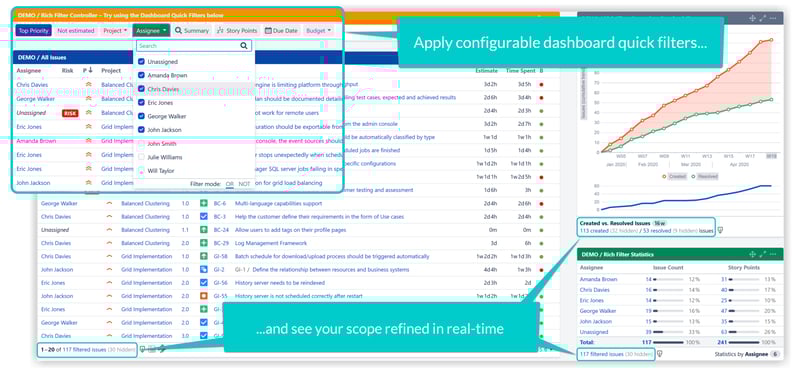 The possibilities Rich Filters for Jira offers right from the Jira dashboards make it a powerful app.
Like the previous case with Custom Charts for Jira, we had a Co-Hosted Webinar with Qotilabs, the creators of Rich Filters. They prepared a short video showing how the integration with Projectrak works.
Before hitting the play button in the following clip showing the integration of Projectrak and Rich Filters for Jira, bear in mind that we have created a field in Projectrak called Project Status, which we have mapped with a field of Jira issues, as we have shown before.
In addition to teaching how to perform a basic setup of Rich Filters, we'll also see how to use the Projectrak fields within the dashboard controller:
For this Co-Hosted Webinar edition, we also invited Communardo, who showed a great solution to structure data in Confluence.
When it comes to Jira reports and/or when users need advanced reports, this app is usually the first choice and is a no-brainer. In addition to reports, eazyBI for Jira provides all the benefits a Business Intelligence (BI) tool for Jira might offer. This makes it very attractive for teams needing to have both operational reports and strategic reports centralized in a single tool. This is a different case from Power BI, which allows connecting the BI tool to Jira.
--project-reports-business-intelligence-Atlassian-DEISER.png?width=800&name=eazyBI-for-Jira-and-projectrak(profields)--project-reports-business-intelligence-Atlassian-DEISER.png) The image above is just a preview of all the charts you can get from Jira data adding eazyBI.
The image above is just a preview of all the charts you can get from Jira data adding eazyBI.
eazyBI is available for Cloud and Data Center and integrates with Projectrak. Currently, it's the only app connected with Projectrak in both hosting options. Nevertheless, that situation will change this year. Projectrak will release its first version in the Cloud with a public API, which will surely ease integration with other Atlassian Marketplace apps.
For this integration, no particular configuration is needed, given that eazyBI extracts all the information from Projectrak through its API without mapping fields to Jira.
We have a video explaining the same situation as the two apps mentioned before. eazyBI took part in the first edition of the Co-Hosted Webinars; there, you will see how eazyBI exploits the information from Projectrak.
Before watching the video, consider that we've previously created three project fields with Projectrak, and we've given it value in different projects. The project fields are Programming Language, Project Status, and Start Date. Look at the video:
An integration alternative to creating project reports in Jira, as well as useful as the ones shown in this article.
It's an app that has been in the Atlassian Marketplace for a short time, available for Jira Cloud, Server, and Data Center. It aims to inform about the evolution and status of the different KPIs associated with Jira Software, Jira Service Management, Bitbucket, or other tools (even outside Atlassian.)
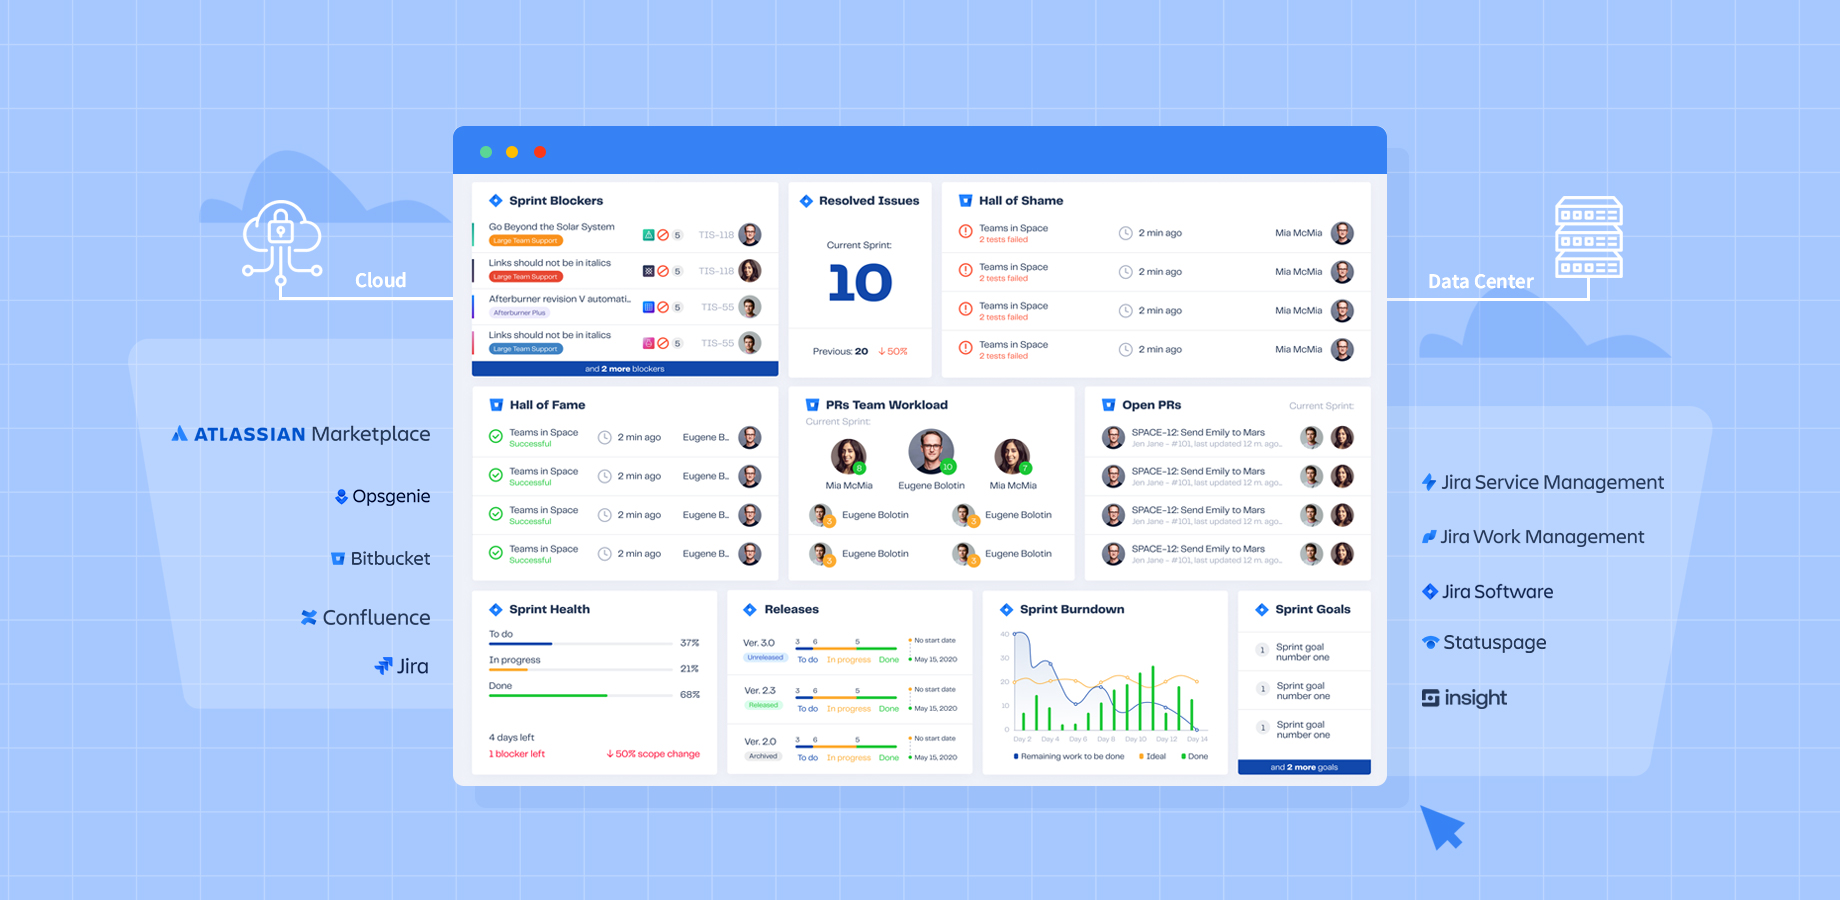 Imagine having a Jira dashboard looking like this containing project information about your Jira projects.
Right after publishing the Projectrak Cloud Public API, we've integrated Dashboard Hub with Projectrak, allowing great ease when creating reports for project tracking in Jira Cloud by embedding in a Jira Dashboard any of the set of gadgets Dashboard Hub offers, these gadgets can be0 fed with project information handled with Projectrak. The following image can give you an idea of the possibilities you can achieve by using this integration:
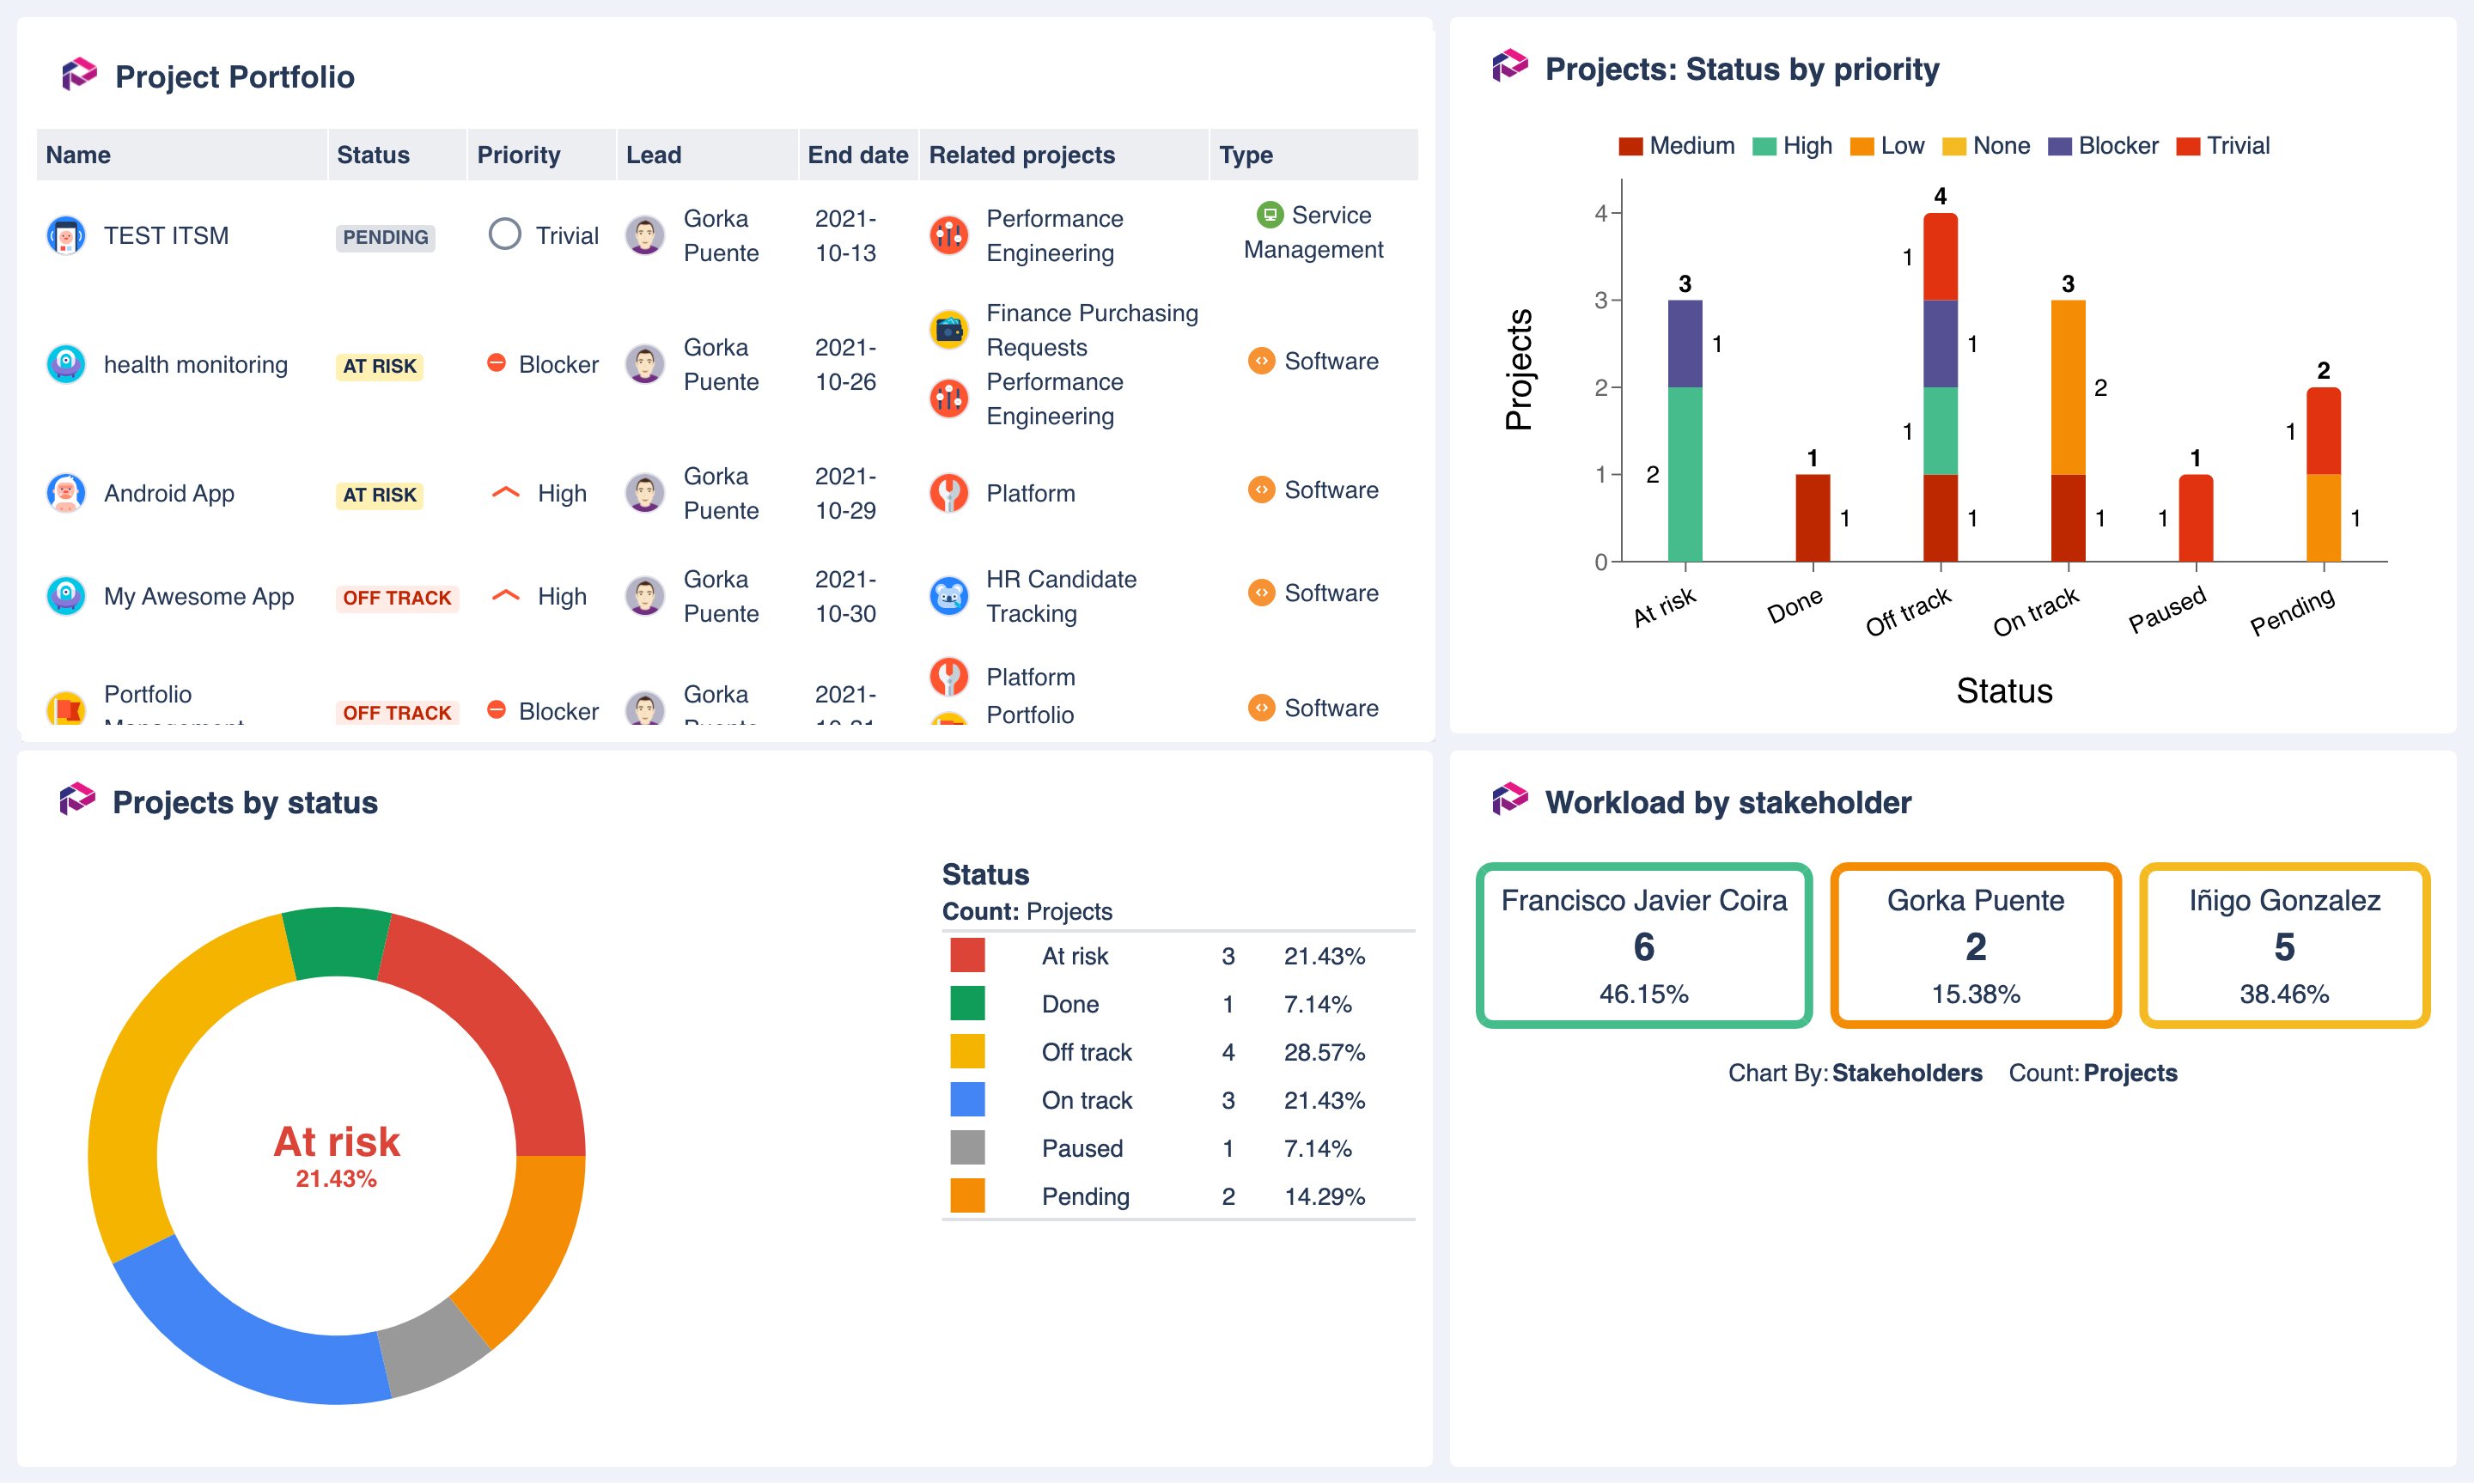
Dashboard Hub gadgets fed with project information from Projectrak for Jira Cloud.
It's an app that doesn't leave anyone who needs to publish Jira Dashboards indifferently, and you will need it if you want to:
Get help enriching your Jira Service Management project reporting with Dashboard Hub >>
As you might see, each app available on the Atlassian Marketplace offers a specific solution to a specific need within Atlassian tools.
Each Atlassian app solves a specific need within the creation of Jira project reports
It's important to note that each app provides a different type of report. Each represents different solutions, and it's even possible to have these apps for reports installed in your Jira; this will depend on your needs.
If you have doubts about which reporting app for Jira is the best, or at least which one best fulfills your needs, we recommend trying them all; by doing so in Data Center, you'll have a 30-day free trial period; in Cloud, you'll have seven days to assess which choice is most suitable for you.
If you need any help, please remember that we're Atlassian Platinum Solution Partners. We help and advise you to find the best possible solution, saving you time and money.


No Comments Yet
Let us know what you think