
How to get maximum value from Jira gadgets and Jira dashboards to track the progress of multiple projects? That’s a question the administrators of the tool can make to themselves when creating reports for projects aiming to find the best way to track multiple projects using Jira; In this publication, we will explain how to maximize your work with the gadgets, and the Jira dashboard multiple projects, it will only be necessary to add Projectrak to the equation. Keep reading.
If you work with Jira, you may already know Jira dashboards and gadgets, and you may likely know their value when obtaining Jira reports and organizing work. If that’s not the case, come with us throughout this blog post, and we’ll explain:
Let’s get started by giving some context about two important pieces in order to get Jira reports for multiple projects, and that would be by building Jira dashboards for multiple projects and gadgets that allow creating reports in Jira. following this way, we will show the best way to keep track of multiple projects in Jira; let's go with the perspective from Atlassian itself:
Atlassian perfectly defines in their documentation what a dashboard in Jira is. We could define it as a landing page in the tool where you can add small and specific pieces of information called gadgets, it comes with statistics and/or summaries of your issues and projects:
"Your dashboard is the main display you see when you log in to Jira. You can create multiple dashboards from different projects, or multiple dashboards for one massive overview of all the work you're involved with.
You can create a personal dashboard and add gadgets to keep track of assignments and issues you're working on. Dashboards are designed to display gadgets that help you organize your projects, assignments, and achievements in different charts."
This is a graphic example of a dashboard in Jira:
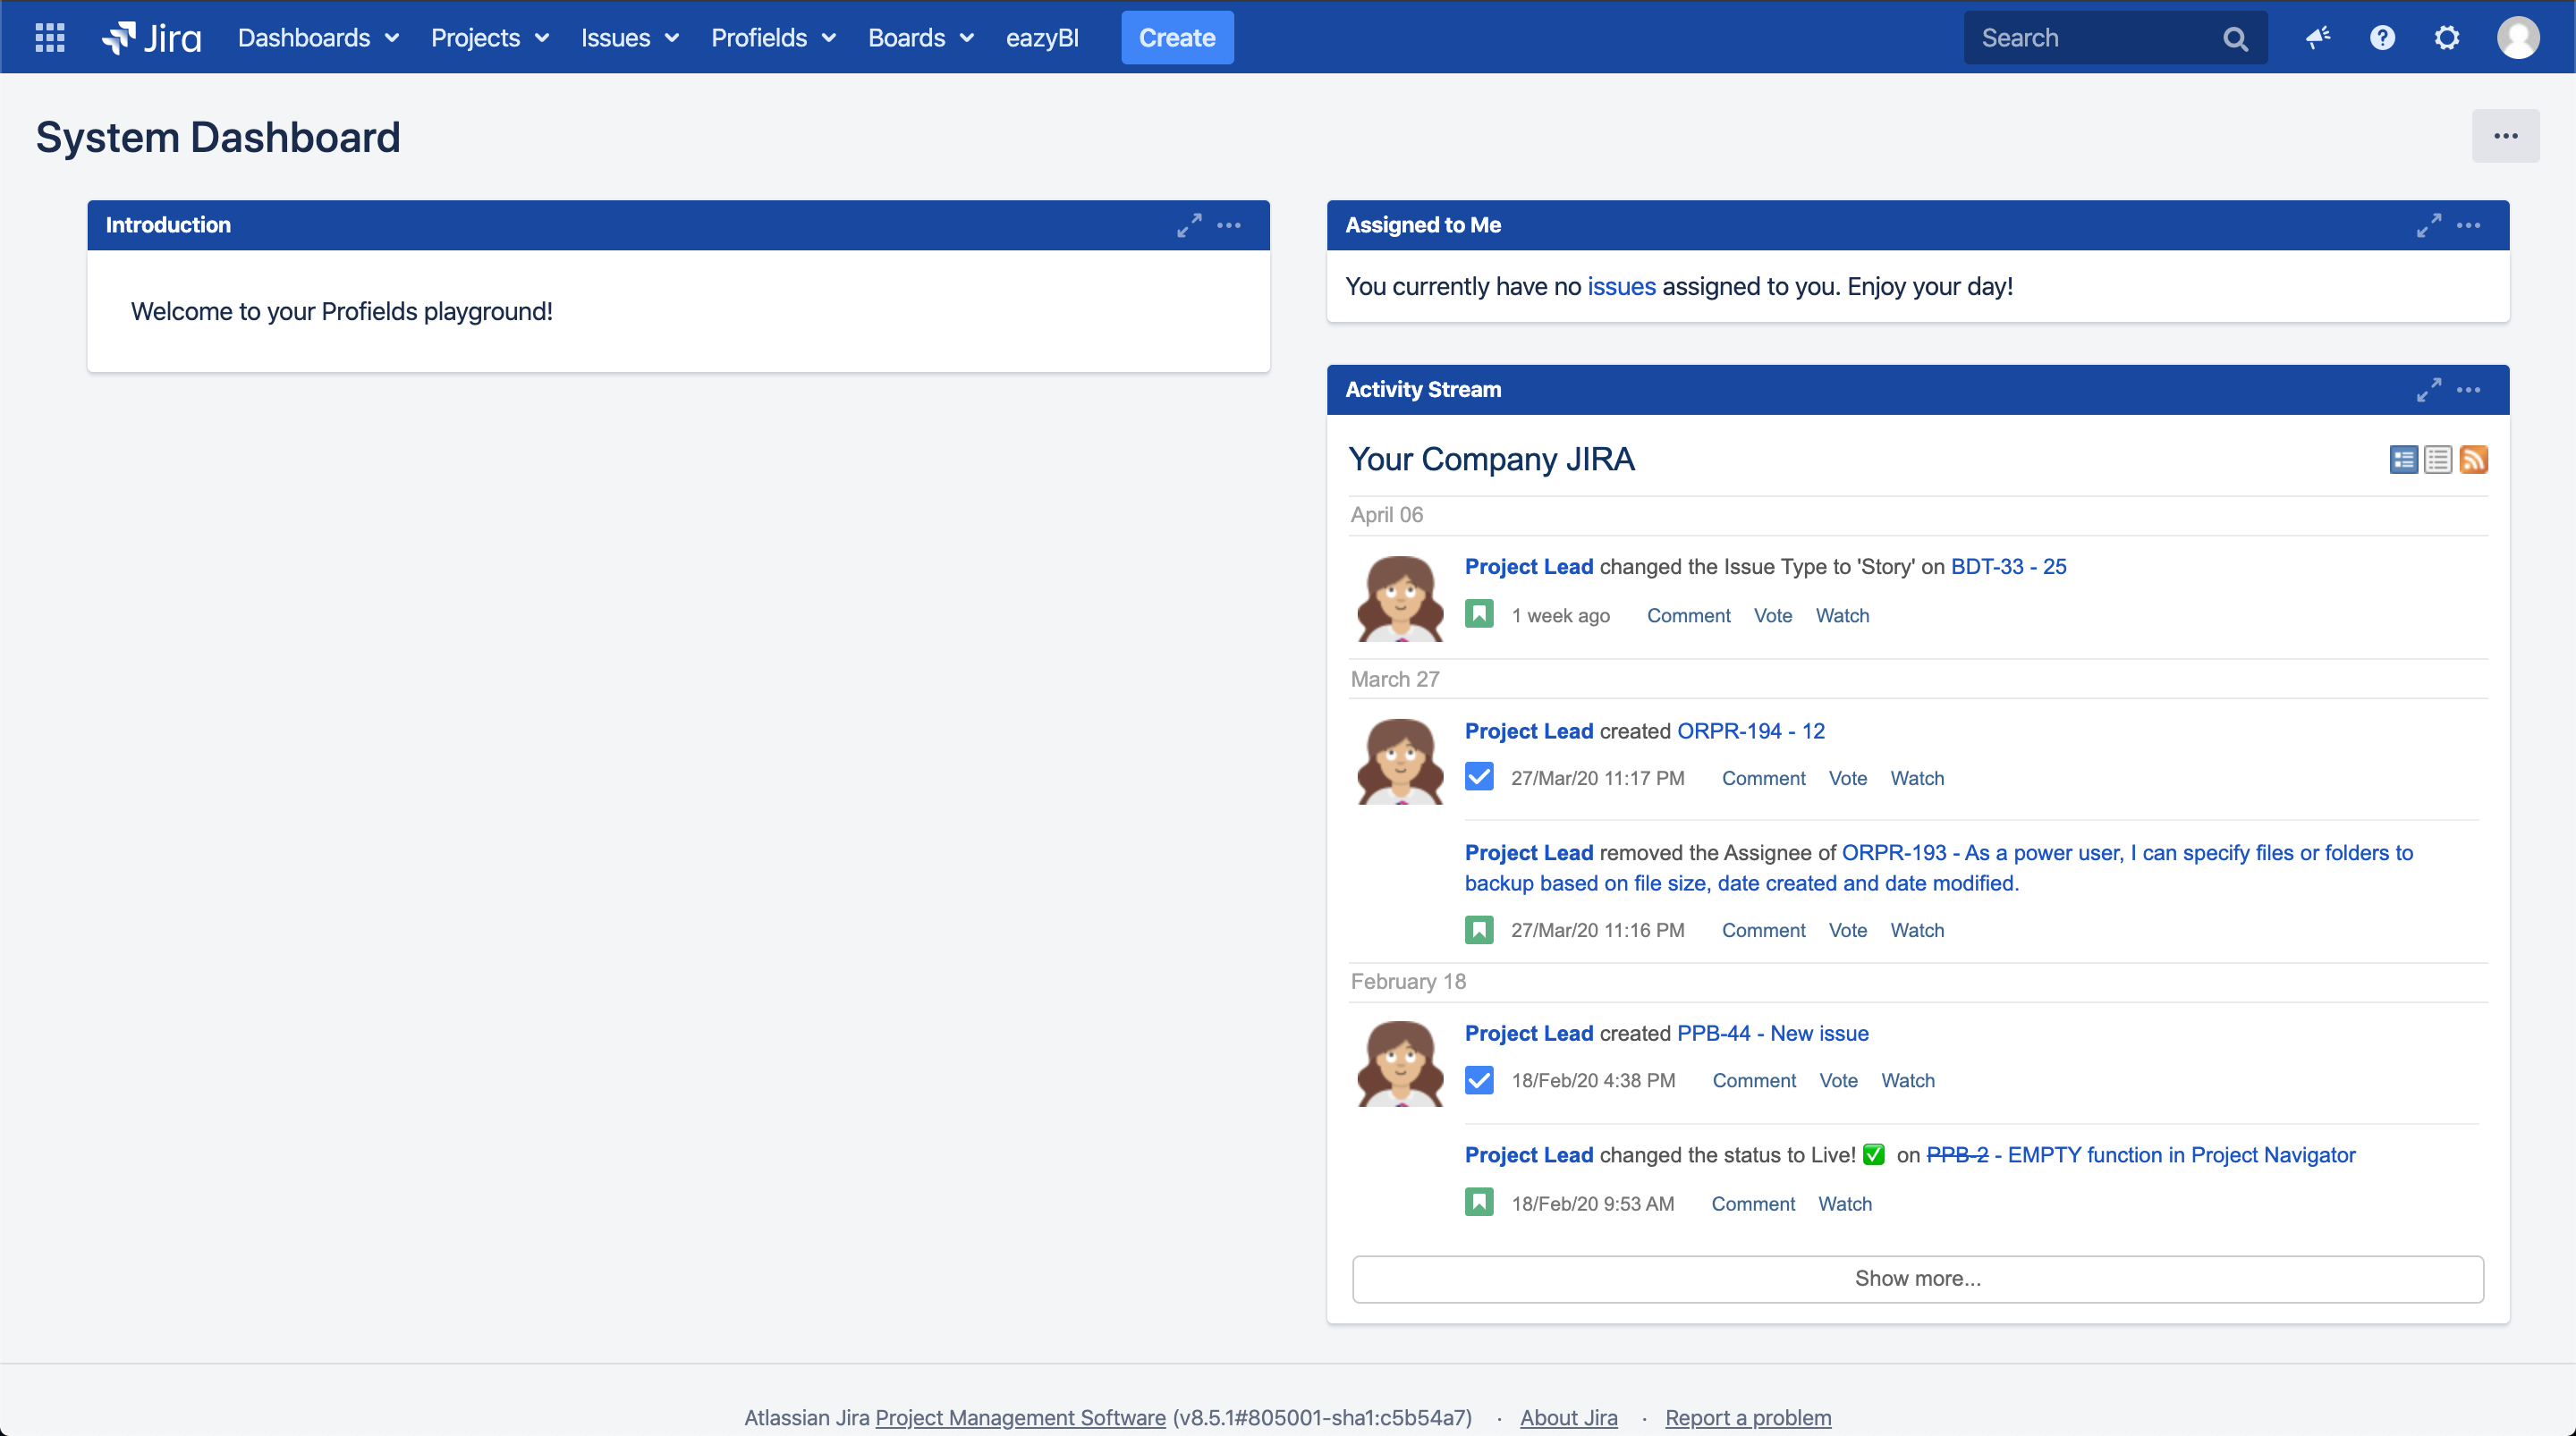
This is how a default dashboard looks in your Jira.
As you can see, gadgets are mentioned several times along the definition offered by Atlassian. The simple truth is that dashboards would not have any sense without their fundamental key: the Jira gadgets.
Atlassian defines a gadget as a “small object (i.e. a piece of functionality) that offers dynamic content that you can put onto a dashboard." By example:
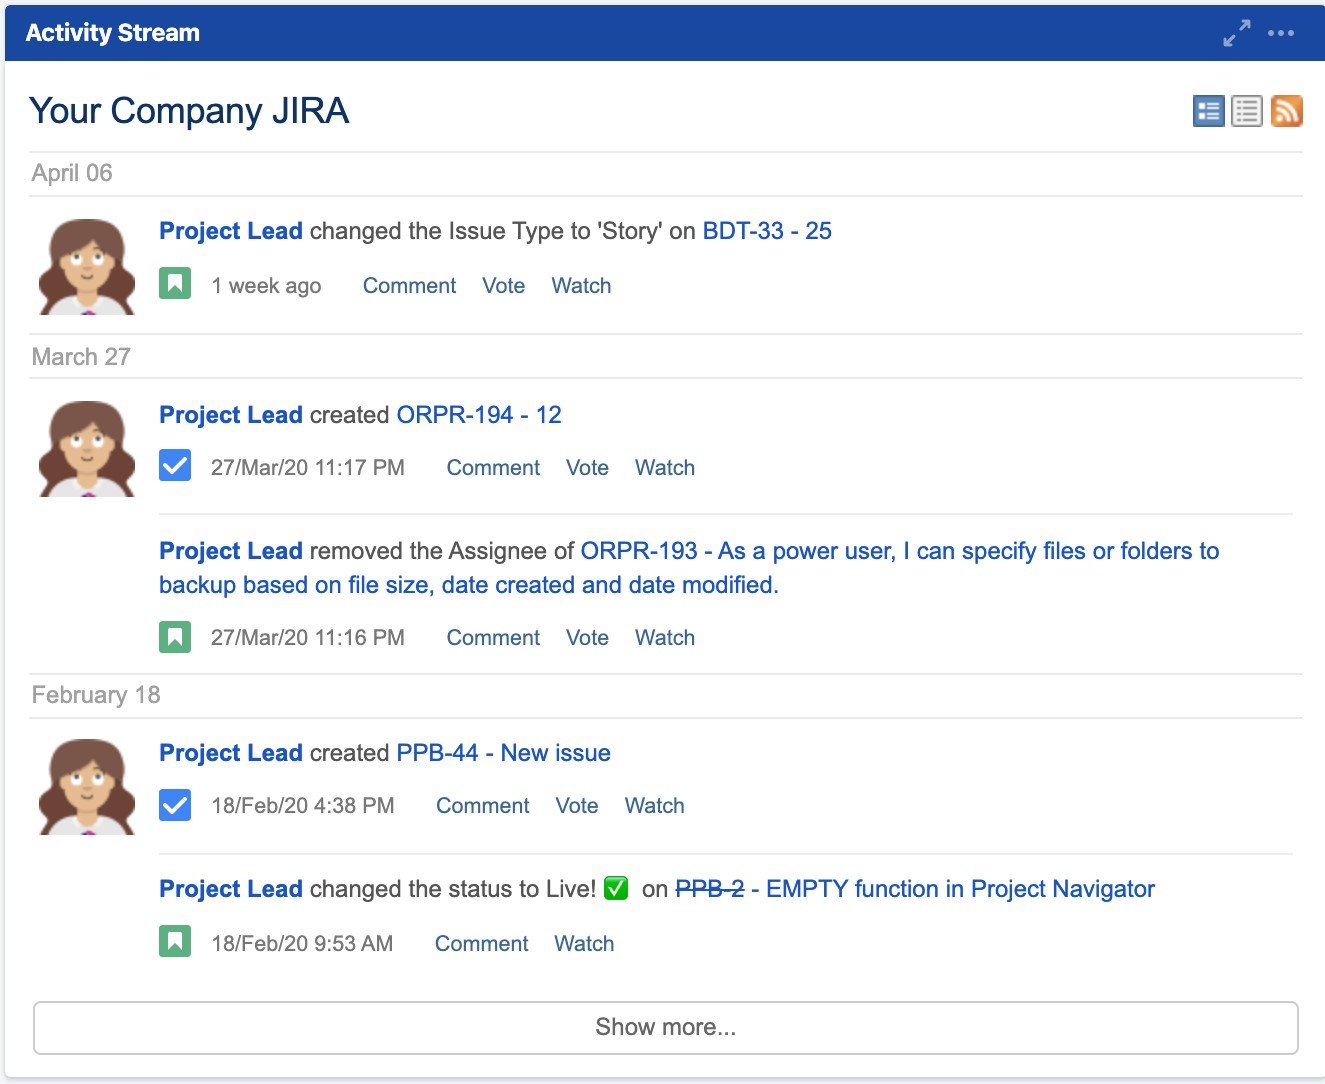
The Activity Stream gadget is basic in Jira and comes with a default dashboard as it was shown in the previous image.
Adding these small objects is primarily targeted to aggregate or summarize information that allows users to be informed about what’s happening in that Jira instance, in real-time, by means of its issues. These gadgets may well be summaries or statistical charts.
That landing page in your Jira instance (read it as a dashboard) is composed of a customizable variety of “small objects” filled with the information you need (gadgets,) in order to keep track of the information necessary to help you accomplish your goals.
When configuring your dashboards in Jira, Atlassian recommends organizing the information shown there, from the point of view of data you need to see and track, leaving apart meaningless data with just information:
“Make it about teams, projects, and tasks,
not about tools.” - Atlassian.
For Atlassian, there is a set of gadgets that will allow you to organize and track your tasks in Jira. There, you will be able to visualize the tasks which are pending (or completed) in other Jira aspects you need to track.
Regarding the Atlassian Marketplace, some apps available there can help to follow-up and control tasks, and the ones providing gadgets for Jira with that information usually offer data about the context of issues, and not about projects.
Regarding Projectrak (previously known as Profields), the landscape changes. Considering this app is targeted to help people track projects with Jira, the information offered by Projectrak gadgets provides a different solution that stands out over other options available at the Atlassian Marketplace.
As you can see in the image below, a dashboard from Jira, displaying the Projectrak gadgets we will explain in the following, looks very different, showing multiple project specific-information tailored by you, for yourself:
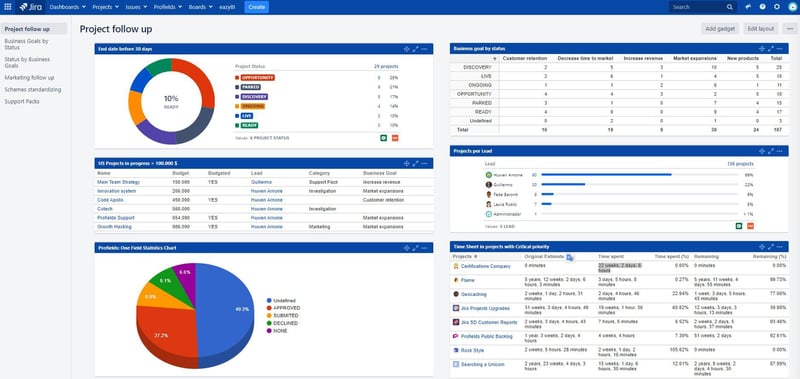 Projectrak gadgets help you organize and track projects right from Jira dashboards.
Projectrak gadgets are available in the Jira gadgets directory, in the dashboards. Before starting to configure them, it is important to keep in mind two key aspects:
Below we show some of the Projectrak gadgets available to be embedded in your Jira dashboards, you will be able to see them once having the app in your Jira instance.
These gadgets will help you obtain better control over your projects in Jira, and have all the information centralized:
This is the most basic gadget of Projectrak. It provides users with a shortcut to those projects they want to visualize in the Jira dashboard by only showing the necessary attributes (i.e. a gadget showing only the projects where you have the Project Lead role).
In order to better understand this gadget, consider this example: Imagine you’re a technical lead and you need to access the stack of products you are working with right from the team dashboard, including a shortcut to the corresponding Bitbucket repository. In the Project Fields Summary gadget of Projectrak, you’ll see something like this:
![]()
From the Projectrak (formerly Profields) Project Fields Summary Gadget is possible to access the information relevant to the project in other tools.
The Projectrak Two-dimensional gadget is very similar to the Jira two-dimensional gadget. It allows you to watch the statistical data for your projects and, in turn, filter by the specific projects you want to track more closely, in table format.
For instance, imagine you have two fields: “Status” (representing the status of the project) and “Business Goal” (representing the business objective for the project). This Projectrak gadget for Jira allows you to cross-check data so you can see how many projects whose Business Goal is Customer Retention is in Discovery status, as you can see in the image below:
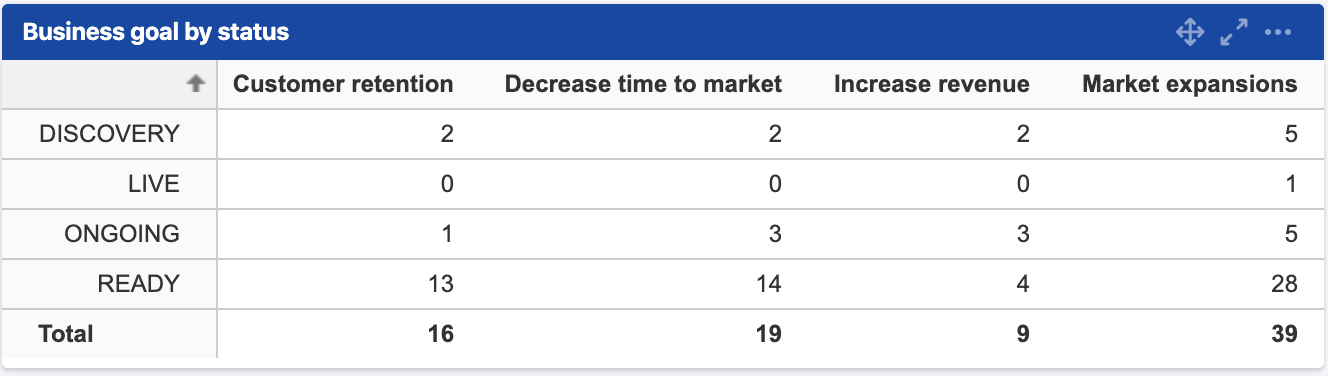 The Projectrak Two-dimensional gadget allows watching statistical data for multiple project-specific information.
Projectrak One Field Statistic gadget aims at showing the total of projects according to a specific field and to represent this information by means of a Bar chart type and allows to export the information to PDF and Excel.
Here's an example for the bar chart type: Imagine you want to know which user has the most projects assigned. In this case, we will watch those of the Project Lead. This gadget lets you watch that information about your Jira project in only two clicks:
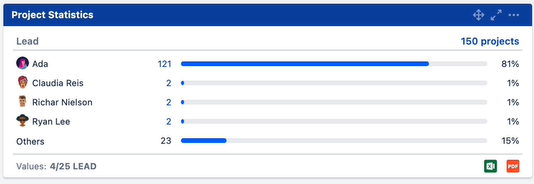
The Projectrak One Field Statistic pie chart gadget for Jira shows project-specific information in a very simple way right from your Jira Dashboard.
Among all the Projectrak gadgets, this is likely the most complex –the reason will be explained later on- and the only one that is only useful when using the “Time Tracking” option from Jira. The objective of the gadget “Project Time Sheet Report” is to show in your Jira dashboard:
When calculating the “Original Estimate” for the project, it uses the following criteria:
In order to compute the “Remaining Estimate”, it will use the following criteria:
In order to help to understand the following example, imagine that each project is led by different companies, each of them being contracted for a specific amount of hours. In this case, we created a field called “Support Pack Size” in these projects, and we have indicated that we want to subtract the “Σ Time Spent” from the “Original Estimate” to compute the remaining hours. This allows us to visualize that the “Certifications Company” project has 3 hours of support left:
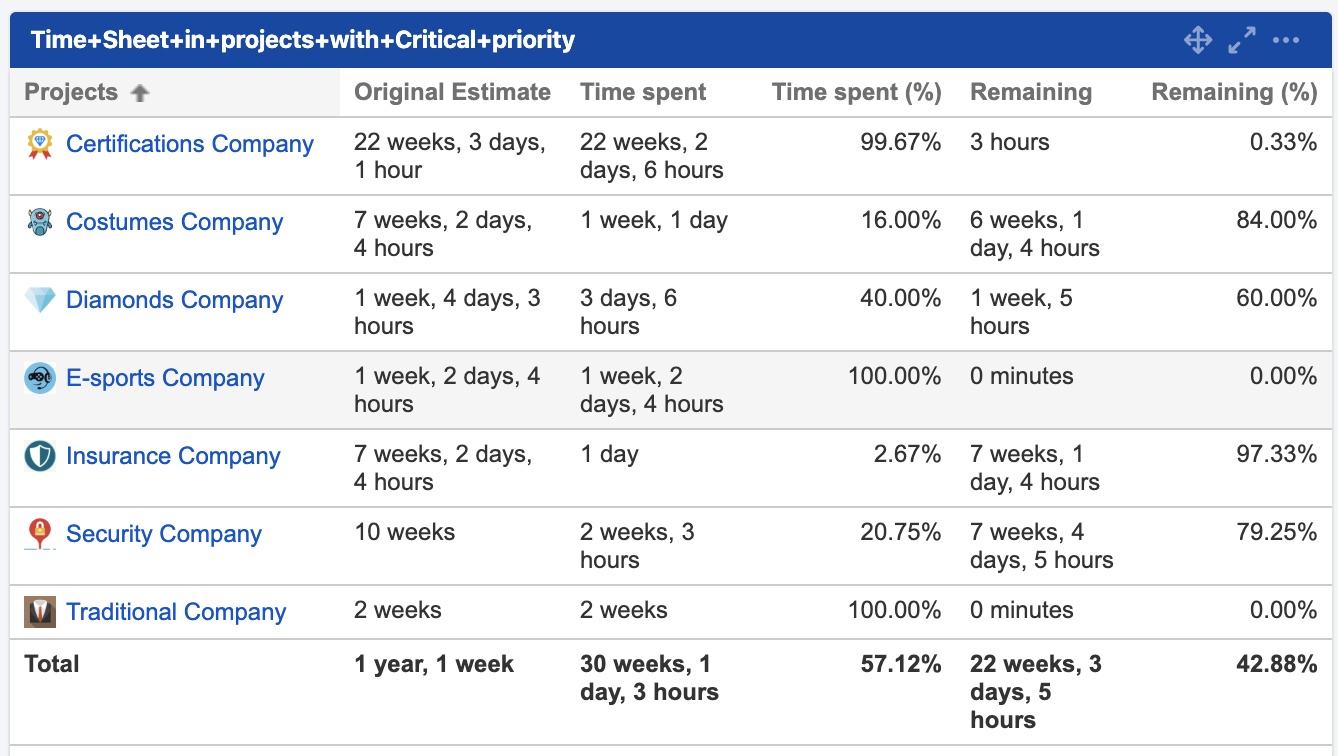
Get a close look at the time invested per project, the example shows a Support Pack (What's a Support Pack?)
This is how our configuration would look like:
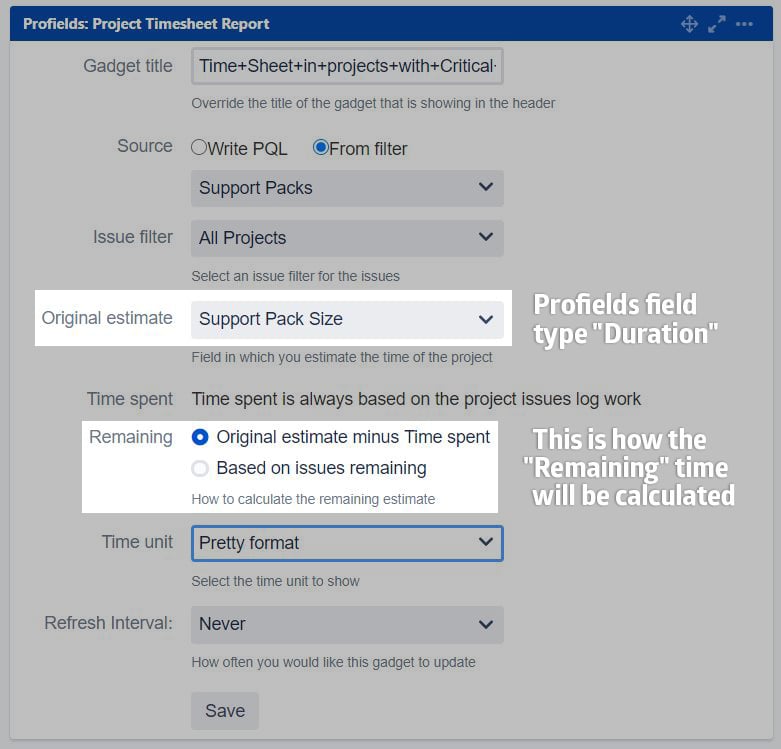
The image shows how to set up the Projectrak Project Timesheet Report gadget for Jira.
With Projectrak 7.3.1 we introduced a new gadget that allows visualizing project-related information in a simple and very visual way!
Check all the possibilities with the Projectrak Pie Chart Gadget
This is a fully actionable Pie Chart Gadget that is linked to the List View, available from the Project Navigator of Projectrak. This chart shows the list of projects that correspond to the linked figure you click on the gadget, also it allows you to have the results into a pre-formatted and actionable Excel spreadsheet by exporting project information from Jira to Excel and PDF.
If you use Jira Data Center or Jira Server, and you are looking to obtain even more advanced and detailed reports, the integration we have shown below may be of great interest to you.
Besides, if you are a Jira Cloud user maybe you would like to have all we have shown above in your instance. If that’s the case, we would like to inform you that we are currently working on bringing all these features offered by Projectrak nowadays for Data Center, to the Cloud version. At the moment, the next solution is everything you need in order to create compelling reports for your projects in Jira.
Stay tuned and subscribe to our blog!
The primary aim of this integration is to create custom reports, charts & dashboards for projects in Jira with Projectrak and eazyBI, nevertheless, this integration represents an alternative to create reports for Jira equally powerful to what we have shown so far… or even more!
This time we will show an example of Projectrak for Jira Cloud.
It’s important to have some background on how eazyBI works. If that’s not the case, we will show you the steps you need to take in order to achieve integrate these two apps in the best possible way.
Imagine you have three fields in your projects:
As a Project Lead, PMO Manager, or any other role in charge of supervising project advance, you need a view with a Gantt chart, generated upon the above-mentioned attributes. To see it, you will only need to:
Import the project fields into eazyBI (previously created in Projectrak) as a property for the reporting app. Create a report with the following setup:
![]() As you can see in the picture, we created a user property (User Defined - Projectrak Progress %) in order to format in % the Progress field coming from the app.
As you can see in the picture, we created a user property (User Defined - Projectrak Progress %) in order to format in % the Progress field coming from the app.
More tips on how to create a Gantt Chart in Jira with eazyBI and Projectrak >>
If you follow the steps above, you will obtain a Gantt chart that will look like this:
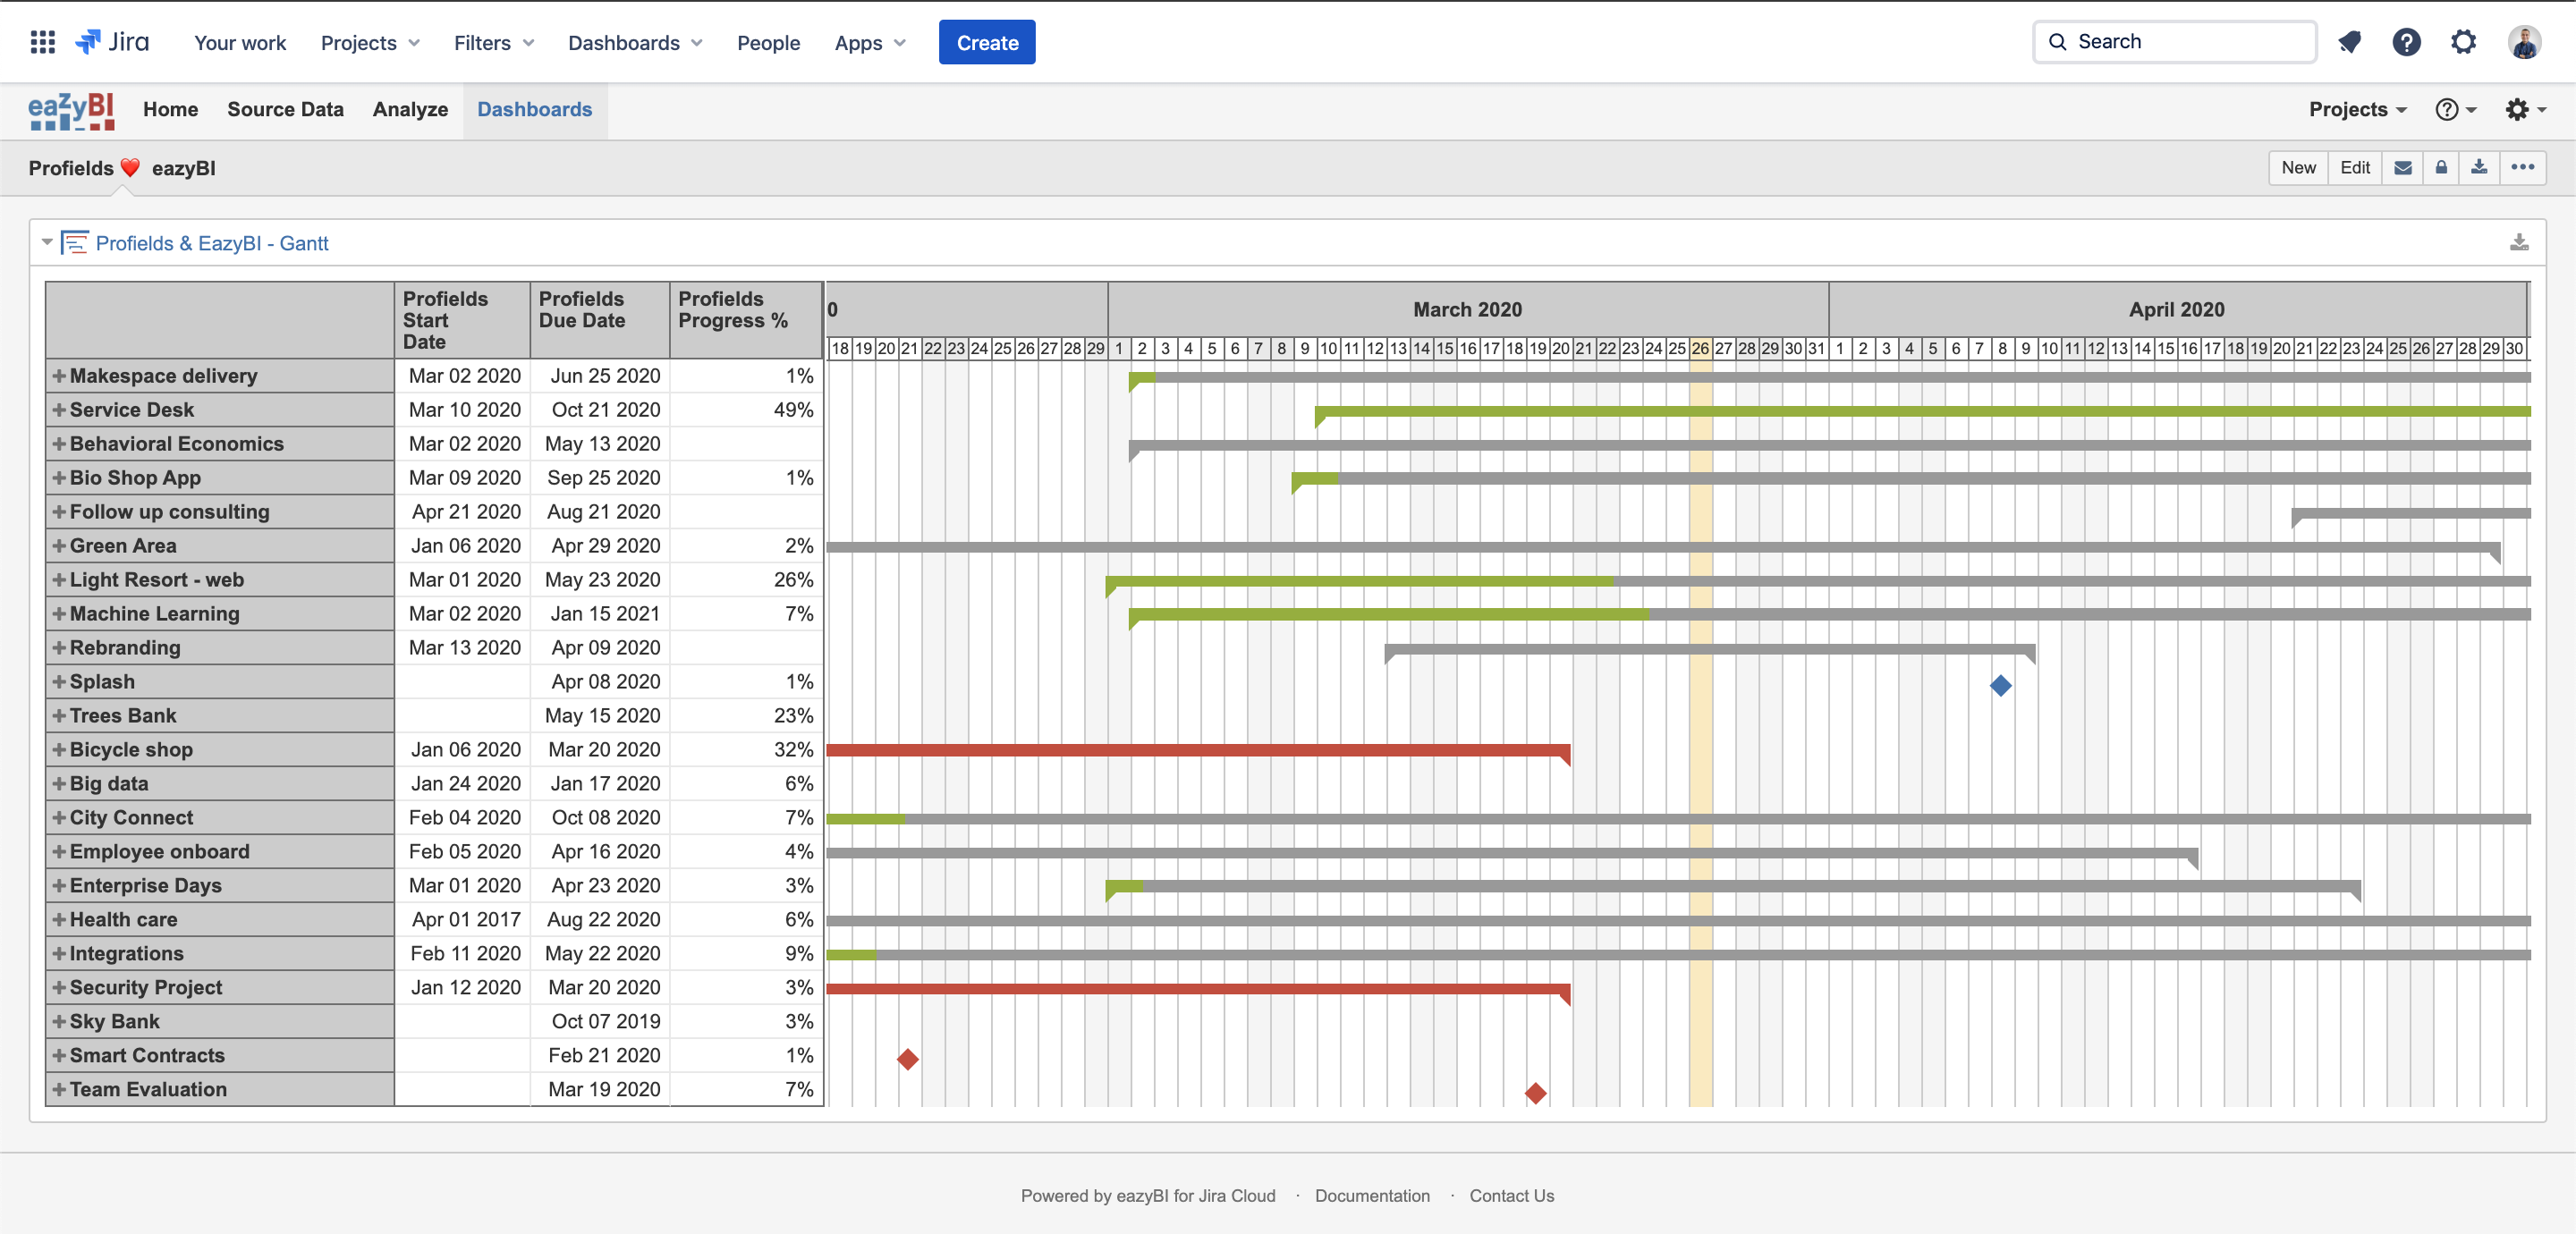 Finally, a Gantt chart with multiple project specific-information was extracted from Projectrak for Jira to eazyBI.
After checking all the possibilities for reports to be added to Jira dashboards as a Projectrak gadget with project information useful and available at a glance, this app will let you track Jira projects in a thoughtful and appropriate way. Therefore, Projectrak will allow you to visualize and centralize all the project information you need to track, according to the needs of your team, your projects, and yourself.
We hope by using these gadgets you’ll find them extremely useful in order to bring project tracking using Jira to the next level.
We recommend getting the resource we offer below; it's a simple guide about Projectrak that shows, differentiating from its hostings (Cloud. Data Center...), how to create, organize and assign value to your projects in Jira in order to, in later stages, achieve a proper tracking of projects using Jira in a simple and flexible way. Check it out!


No Comments Yet
Let us know what you think