
The Jira Project Reporting Academy has begun the first lesson of a series of articles that will show how to build a dashboard of project reports in Jira using the integration between eazyBI and Projectrak (formerly Profields), as it's the most effective and organic way to tracking Jira projects.
Besides what you'll learn in this lesson, which is how to set Projectrak as a source for project and cross-project information in eazyBI, throughout the 4 fascicles, you’ll learn how to obtain the best from Jira projects data visualization:
In this first lesson, taking advantage of Projectrak and tracking projects using Jira, we’ll explain how to create the first report on eazyBI with data from Projectrak. Every article is designed as a step-by-step guide. By enrolling in the Academy, you'll additionally receive a DIY Checklist to help you create your own set of project reports, independently of my particular choices.
In future classes, I’ll show you how to create different graphs and grids to represent Jira + Projectrak data and combine them into a dashboard that helps you with project planning and decision-making. Here’s the full syllabus.
Start by discovering how to leverage the Atlassian marketplace to transform Jira into a project tracker. Whether you are a project manager, a product manager, or any other type of role with Jira projects, Projectrak will help you centralize and manage your project-level data.
For example, you can store important information about your projects, including:
The immediate win is to have that information displayed in the Project Navigator.
Having accurate and permanently updated information is important, but probably not an end in and of itself. The real need is... reporting.
Put succinctly, one of the main needs of a project manager is:
To have reports that can be used to keep projects under control.
It’s so easy to miss something important in a project when you’re not the only person running it! Additionally, your boss will likely want to see objective data about the project that explains how it is doing and whether it will succeed.
That’s why having a dashboard like this is the dream for every project manager: with it, anyone can see the evolution of a project at a glance and take corrective actions when needed.

There are several reporting apps in the Atlassian marketplace, but eazyBI is the must-have tool for Business Intelligence: it’s flexible, versatile, and sophisticated.
If you ever get lost with eazyBI (particularly if you don't follow my exact steps because you want to implement different metrics), feel free to browse eazyBI's amazing documentation. Here's the article on the main terms and concepts.
Combining eazyBI with Projectrak, project managers are allowed to:
Ok, let’s get started with what’s probably the most important dimension for controlling projects:
If you have a project for a customer, the first thing you’ll probably look at is the budget line and how you will spend it. In this section, we’ll see all the steps required to configure a project with all the required data so that we can then configure eazyBI to show the results!
We start by defining the following Projectrak fields:
Below you can see the field page of Projectrak with those two fields.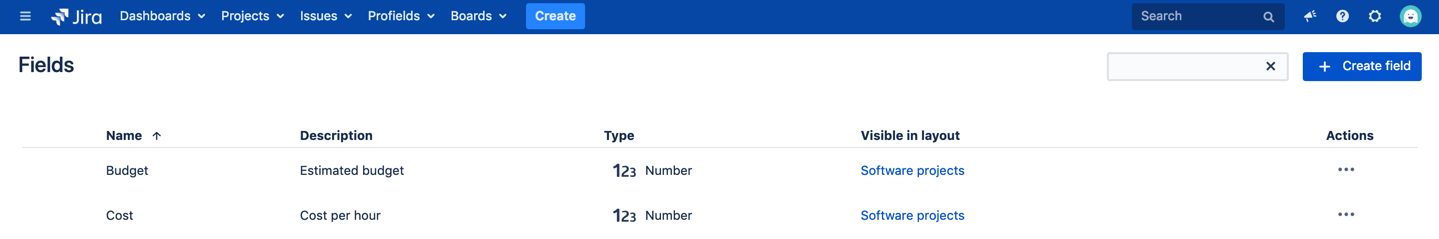
Next, we create a project Layout with both fields. This layout is already associated with my projects.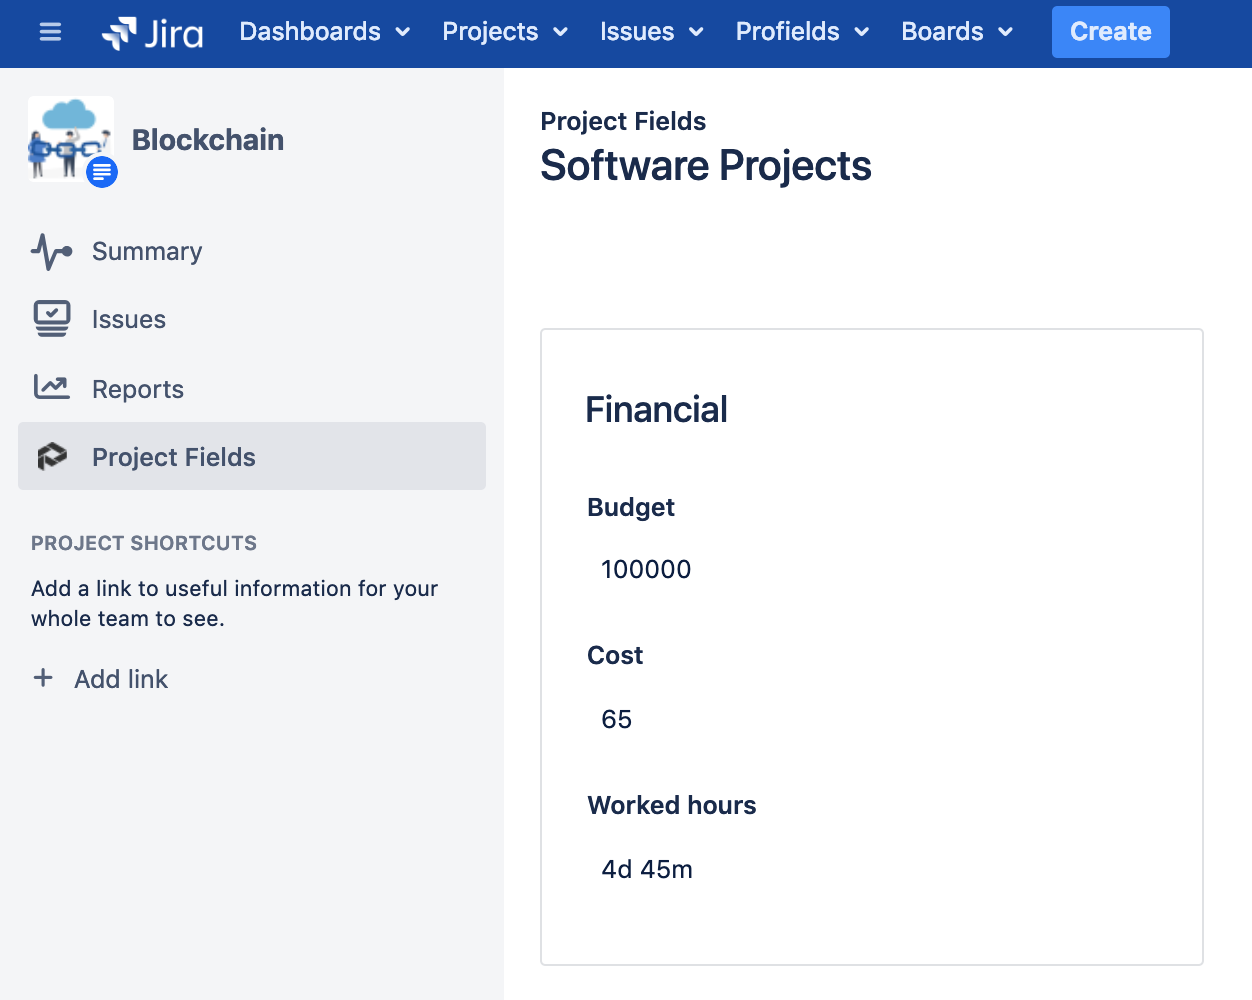
Now, let’s switch to eazyBI, define how we want to import data and define which project fields we want to manage in eazyBI.
Since Projectrak has native integration with eazyBI, you can simply go to the apps tab in the Jira import options.
First, we’ll set the two project fields of Projectrak to be imported as both measure and property. You can check the documentation here for other available options.>
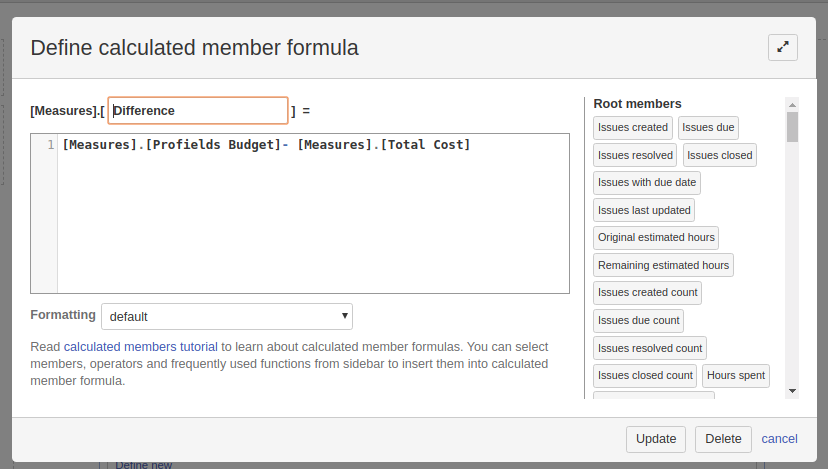
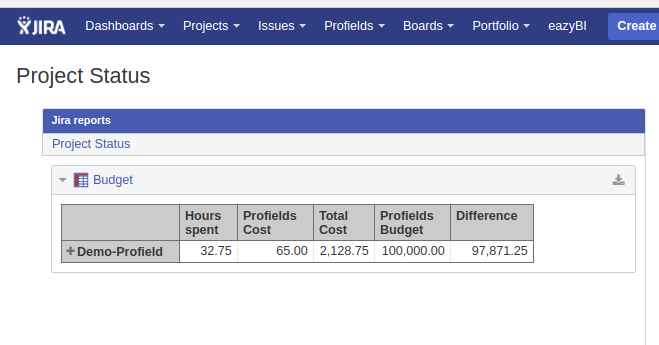
After the import, we’ll define our report using eazyBI's available measures.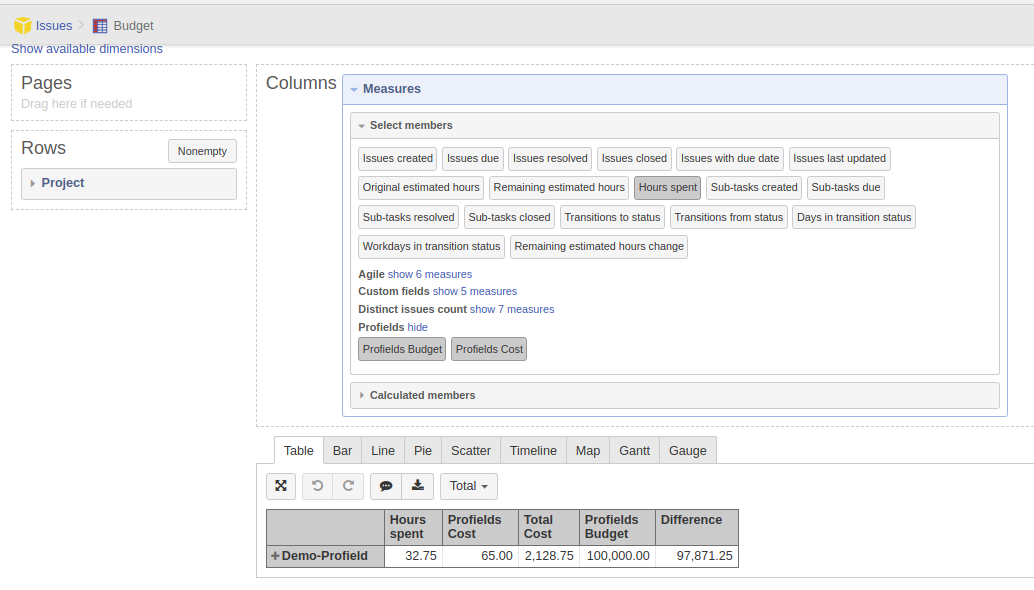
...and include all this information:
Finally, we’ll place the report in our own dashboard, where we can see immediately how the project is progressing.
This is the first step of this journey. In the next article, you'll see how to create the first chart and other parts of the Project Manager dashboard.


No Comments Yet
Let us know what you think