

The Jira Project Reporting Academy is coming to an end, a four step course that shows the best practice on how to centralize project data and visualize it with Projectrak (formerly Profields) and eazyBI. This time, you'll learn how to create a Jira project dashboard.
This fourth lesson of the Jira Project Reporting Academy shows how to put together the pieces we’ve built until now to create a dashboard on a project level. Just be sure to find the resources in our blog, and then follow the steps summarized below:
In previous parts, we defined three types of charts with project data: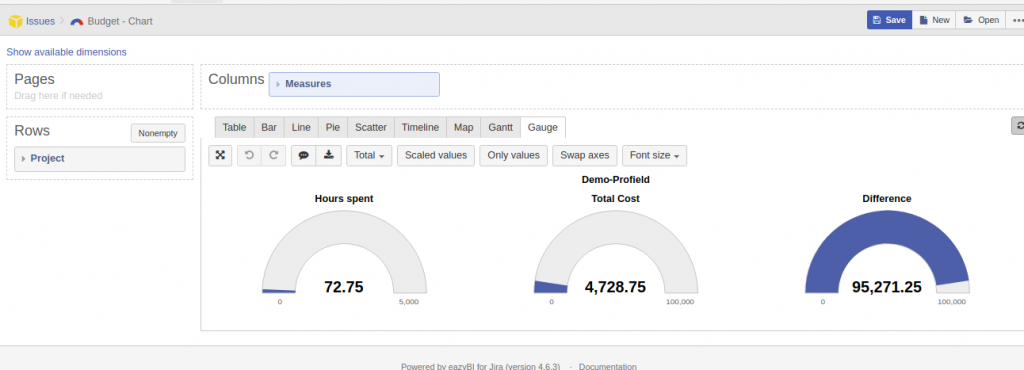
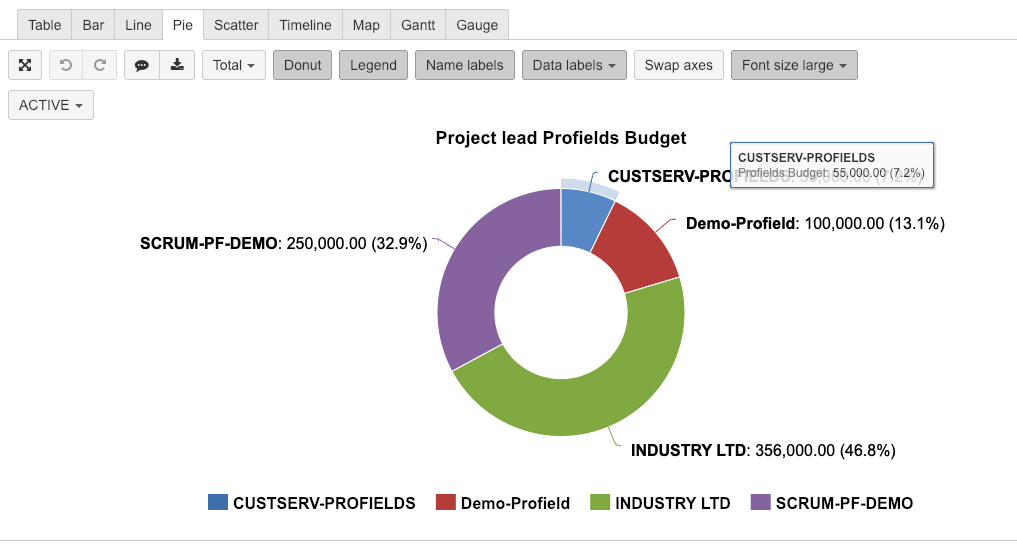
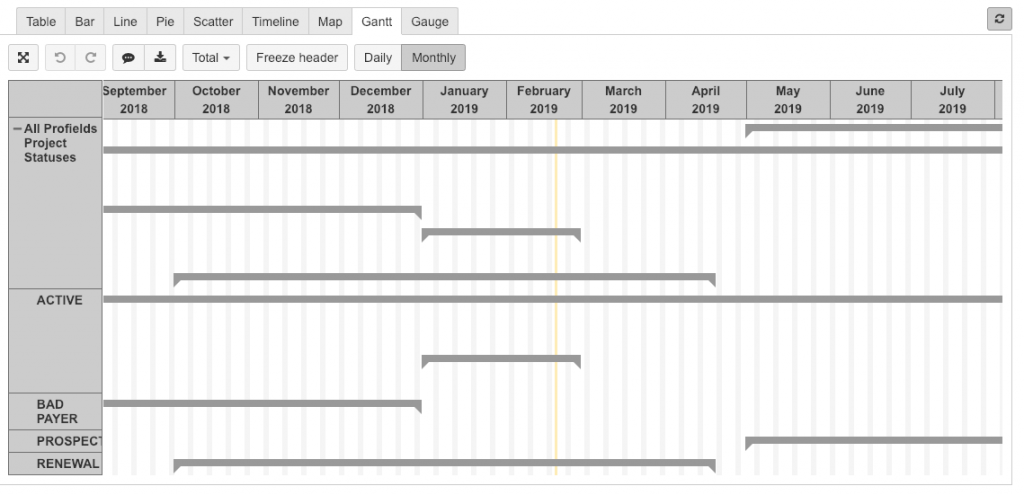
Now that we have the charts, I want to place them side by side to build a dashboard that will allow me to have my information always under control.
Since data is loaded on eazyBI, this dashboard will be created inside the app and then loaded as a gadget on the dashboard tab in Jira.
On the upper menu, let’s navigate to Dashboards and hit the button Create a new dashboard.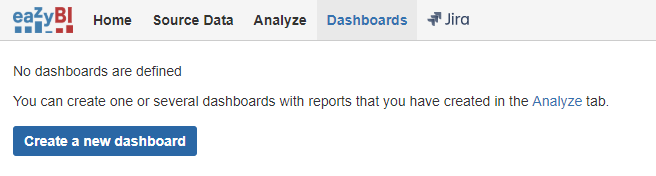
We'll prompt this menu: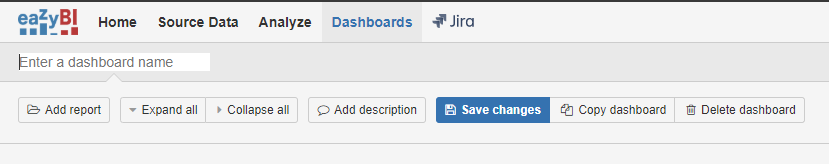
After that, I just have to select the reports I want to include: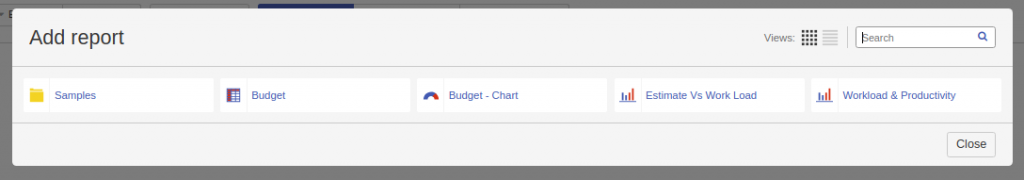
Then, save the project dashboard.
Now I have to switch to Jira, where I’ll have to configure the Dashboard. Let's add the eazyBI gadget.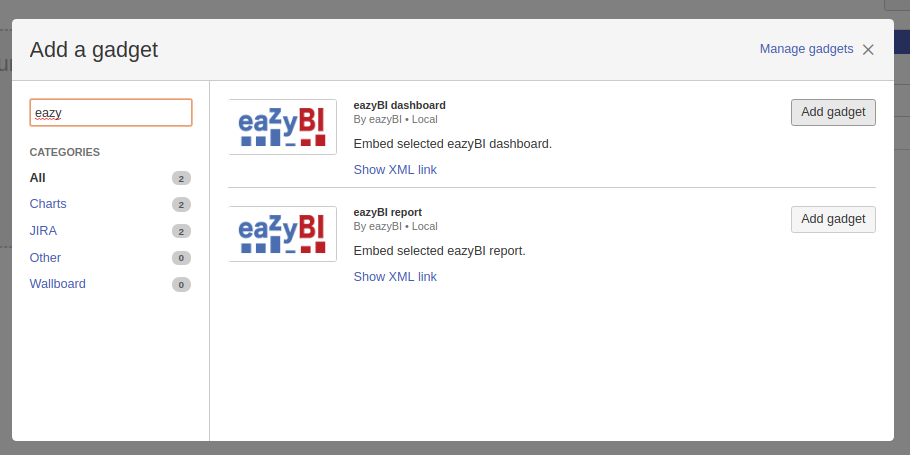
The gadget configuration is very easy, as you can see in the image below: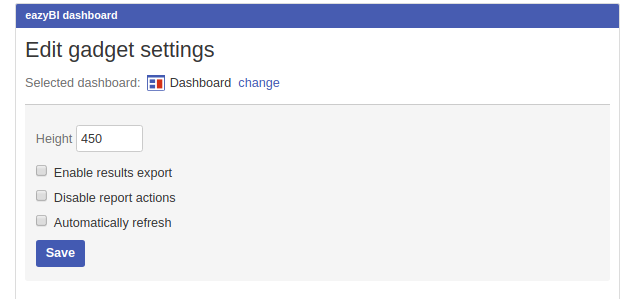
This is the final result: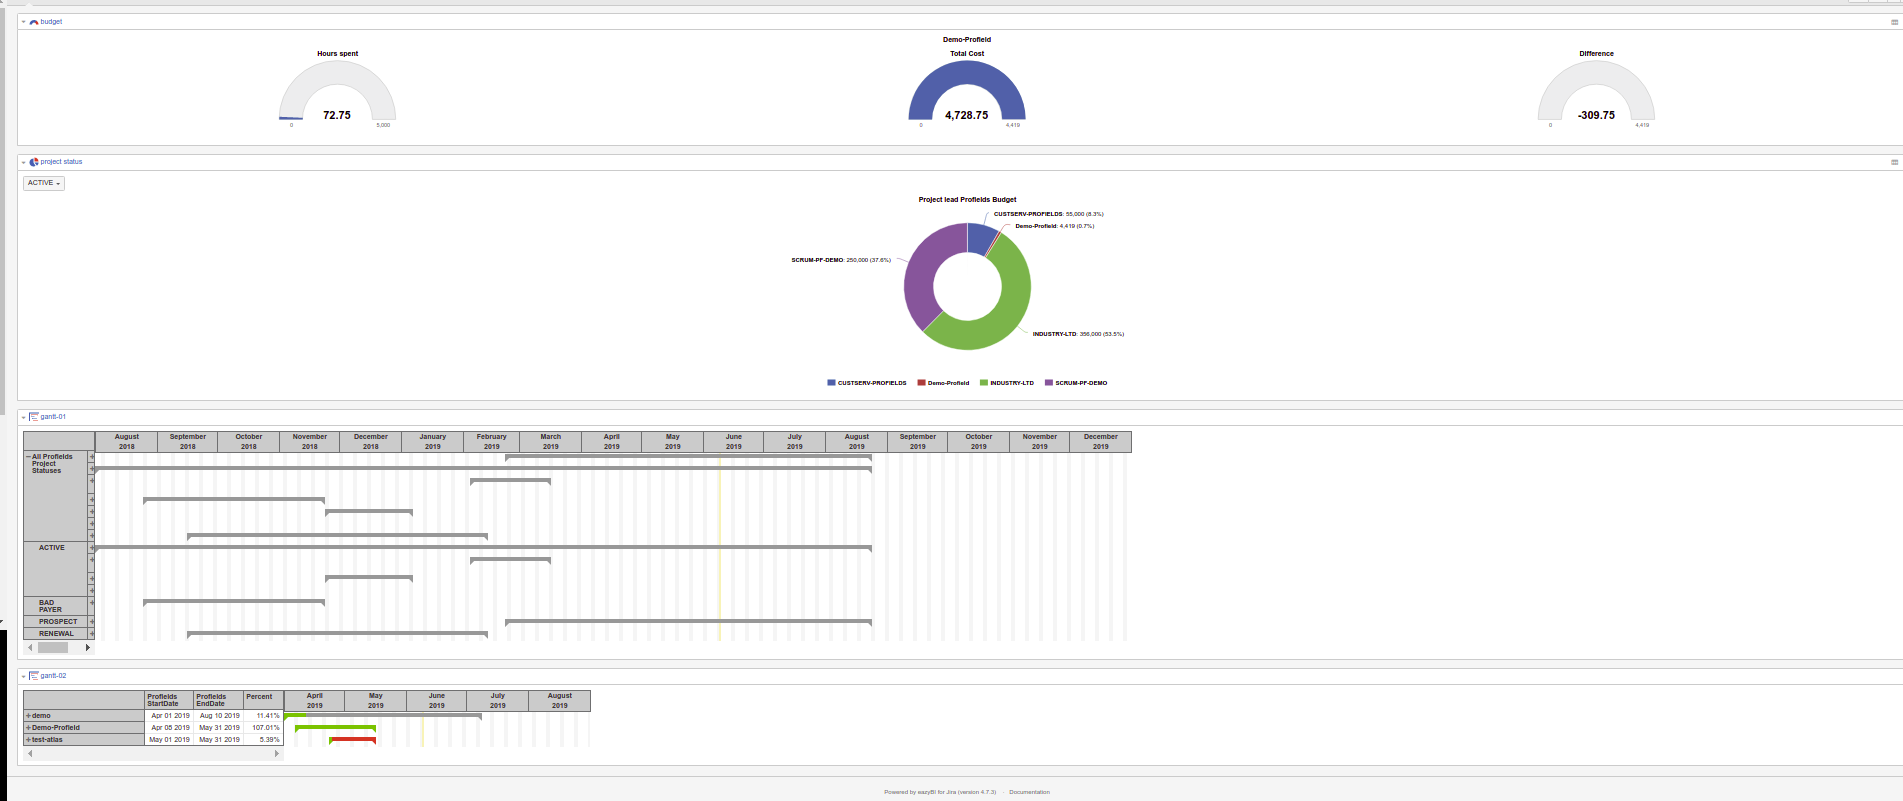
We have seen how eazyBI is the tool that best helps us analyze Jira's data and how, through the combined use of Projectrak and our imagination, it allows us to keep a project under control.
Congratulations on completing the Jira Project Reporting Academy! I hope these steps have stimulated your imagination on how you can analyze the untapped data that lives in Jira to keep improving how you work.
Of course, this is just the beginning, and there are endless possibilities for continuing to work on project reports. We'll keep adding content to the Jira Project Reporting Academy to help you practice and refine your skills. Stay tuned!


No Comments Yet
Let us know what you think