
From a wider perspective, tracking projects or products can be done in two ways, through the views the tool offers or by means of reports. In both cases, the main objective is the same: to offer Project Managers, Product Managers, and/or different stakeholders the information about their projects or products as they need it. That's why in this blog post, we will show your options available when creating reports in Jira to visually track projects through reports.
Visually tracking projects can be done by creating reports in Jira, unlike views, this involves strategic or high-level monitoring of projects. By introducing a mechanism that allows project stakeholders to group data, create a list and/or an enumeration, create fine-tuned reports, and help the team make better decisions to better control projects.
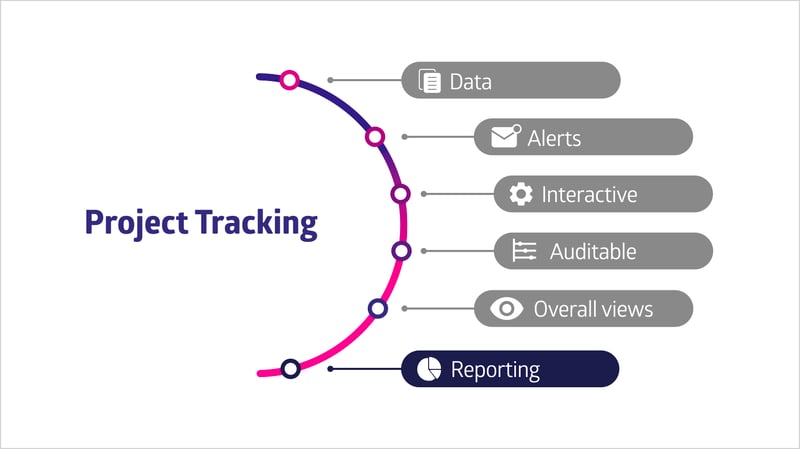 The Project Tracking Bow shows reporting as one of the main pillars within this project management practice.
The power of the reports will depend on the tool you use (Jira, in our case), although, unlike views, project reports in Jira can be extracted using external tools such as Microsoft Excel or specific Business Intelligence tools such as eazyBI, Qlik, or PowerBI. Nevertheless, here we will mention a bit about them.
Let's describe how to create reports in Jira to track projects:
![]()
Projects in Jira can be anything, and this is basic, as you can see above. In addition, we must differentiate if we are using Jira Core, Jira Software, or Jira Service Management, so first we will make an approach to how to track projects in Jira through the project reports, and then through gadgets and dashboards Jira brings:
Each project, depending on its type, incorporates one report or the other. Besides, in the case of Software projects, the reports will depend on the type of board, so it is possible that the same project has different reports depending on the board you are using (Scrum or Kanban). To sum up, these are the types of reports that you can find:
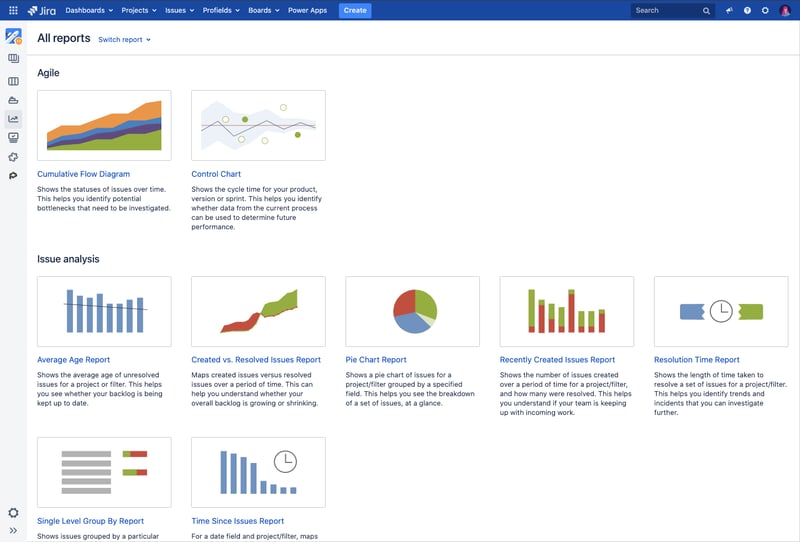
Business projects in Jira incorporate a series of reports where you can analyze the project data added from the issues (if you want to better understand each report, we recommend reading the Atlassian documentation). These reports are typical "bug tracking" tool reports, where the lifetime of the issues has a lot to do with it.
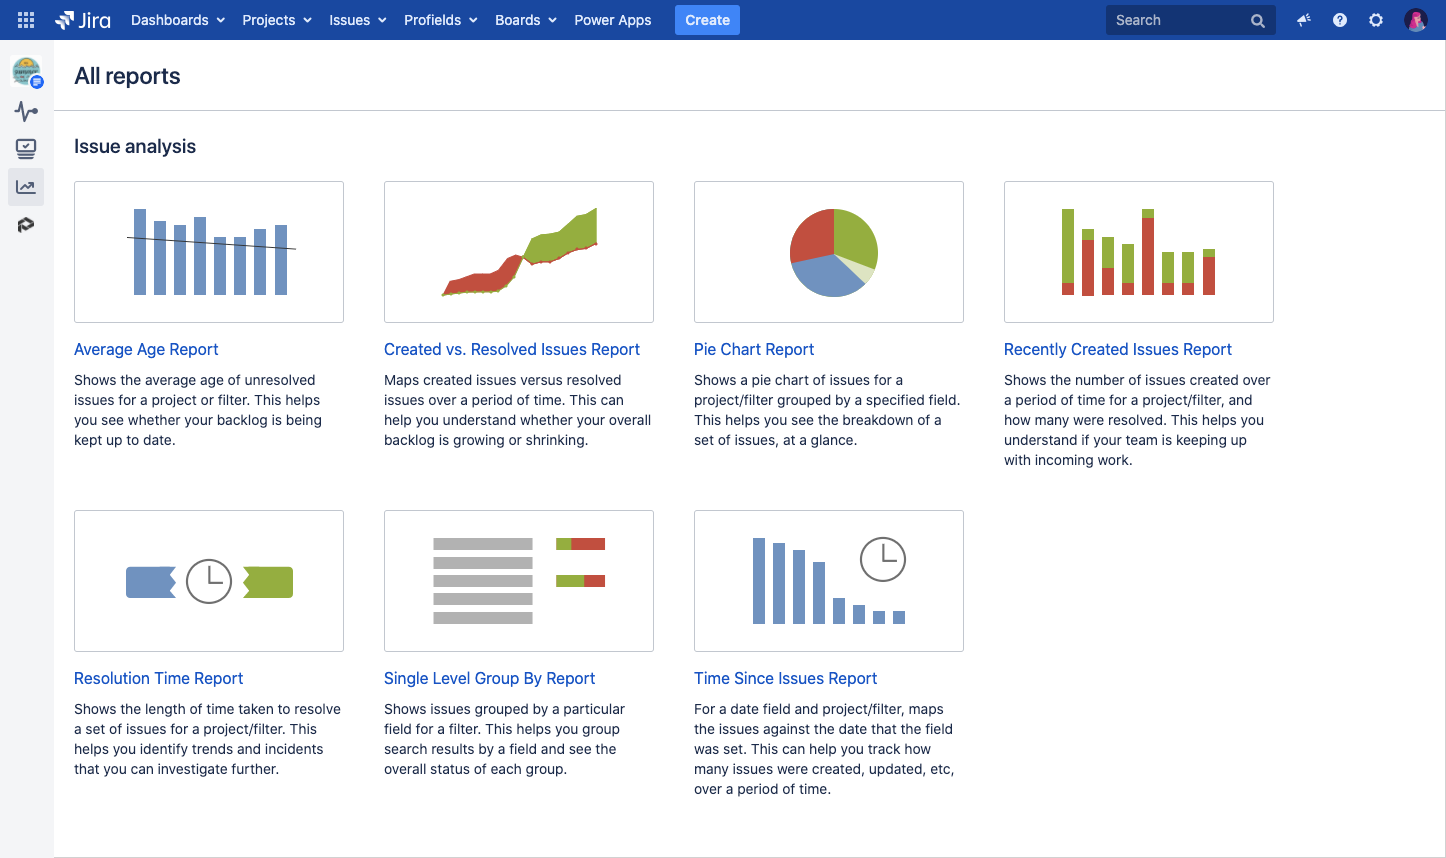
The different reports Jira offers for issues
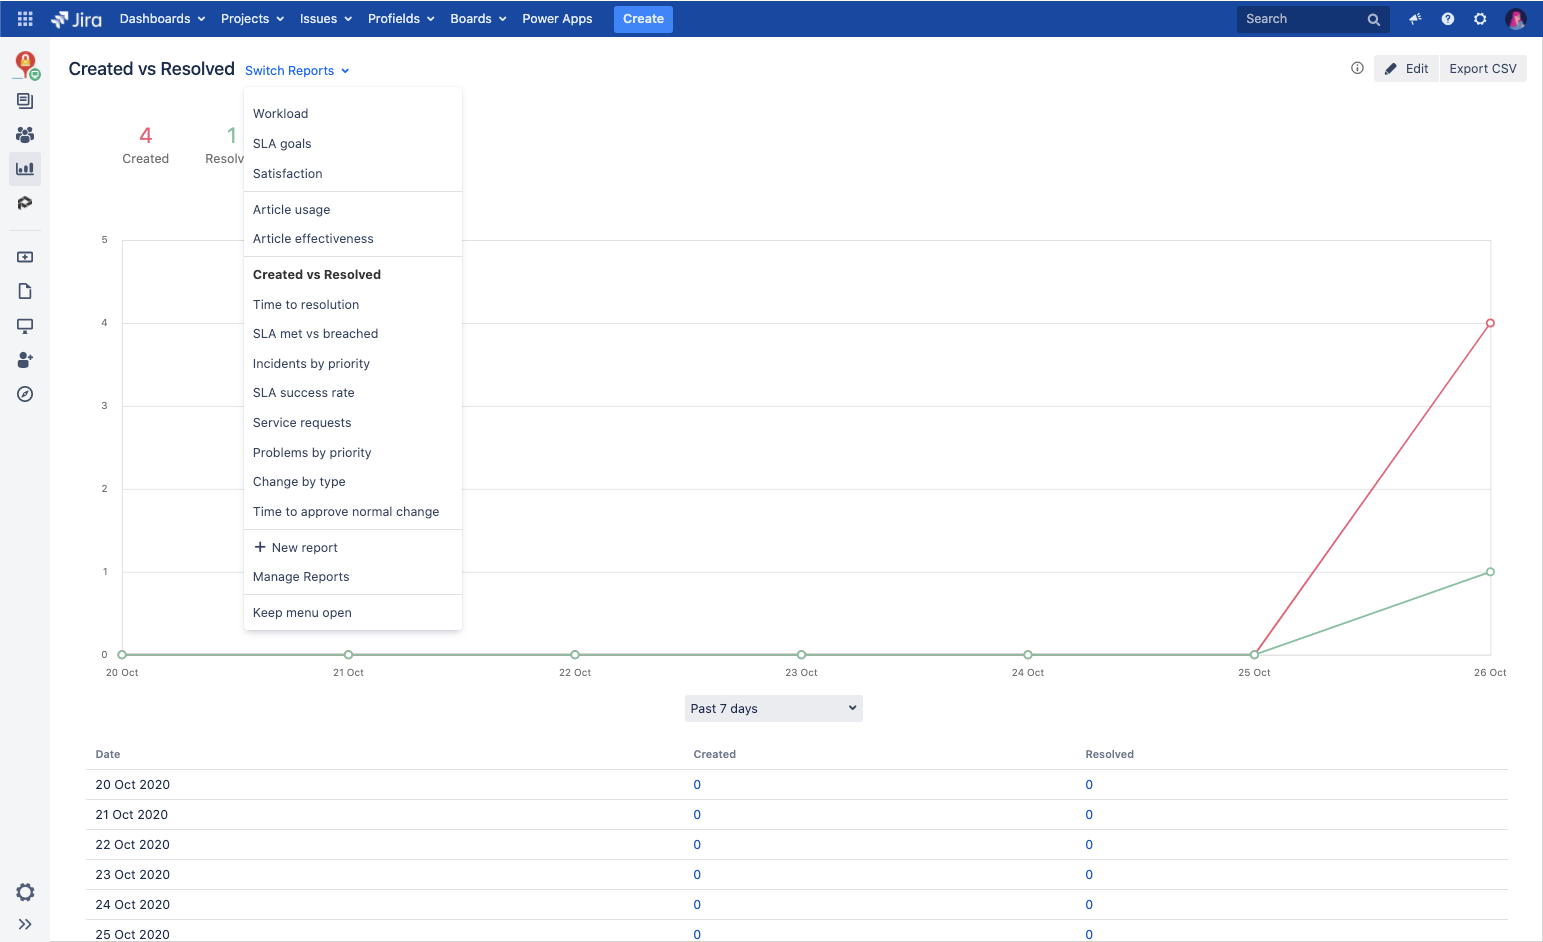
An example of this is the "Created vs Resolved" report that we present below. There we can see a progression of the total issues created against the total issues resolved. On the left of the following image, you can find the configuration, and the result on the right:
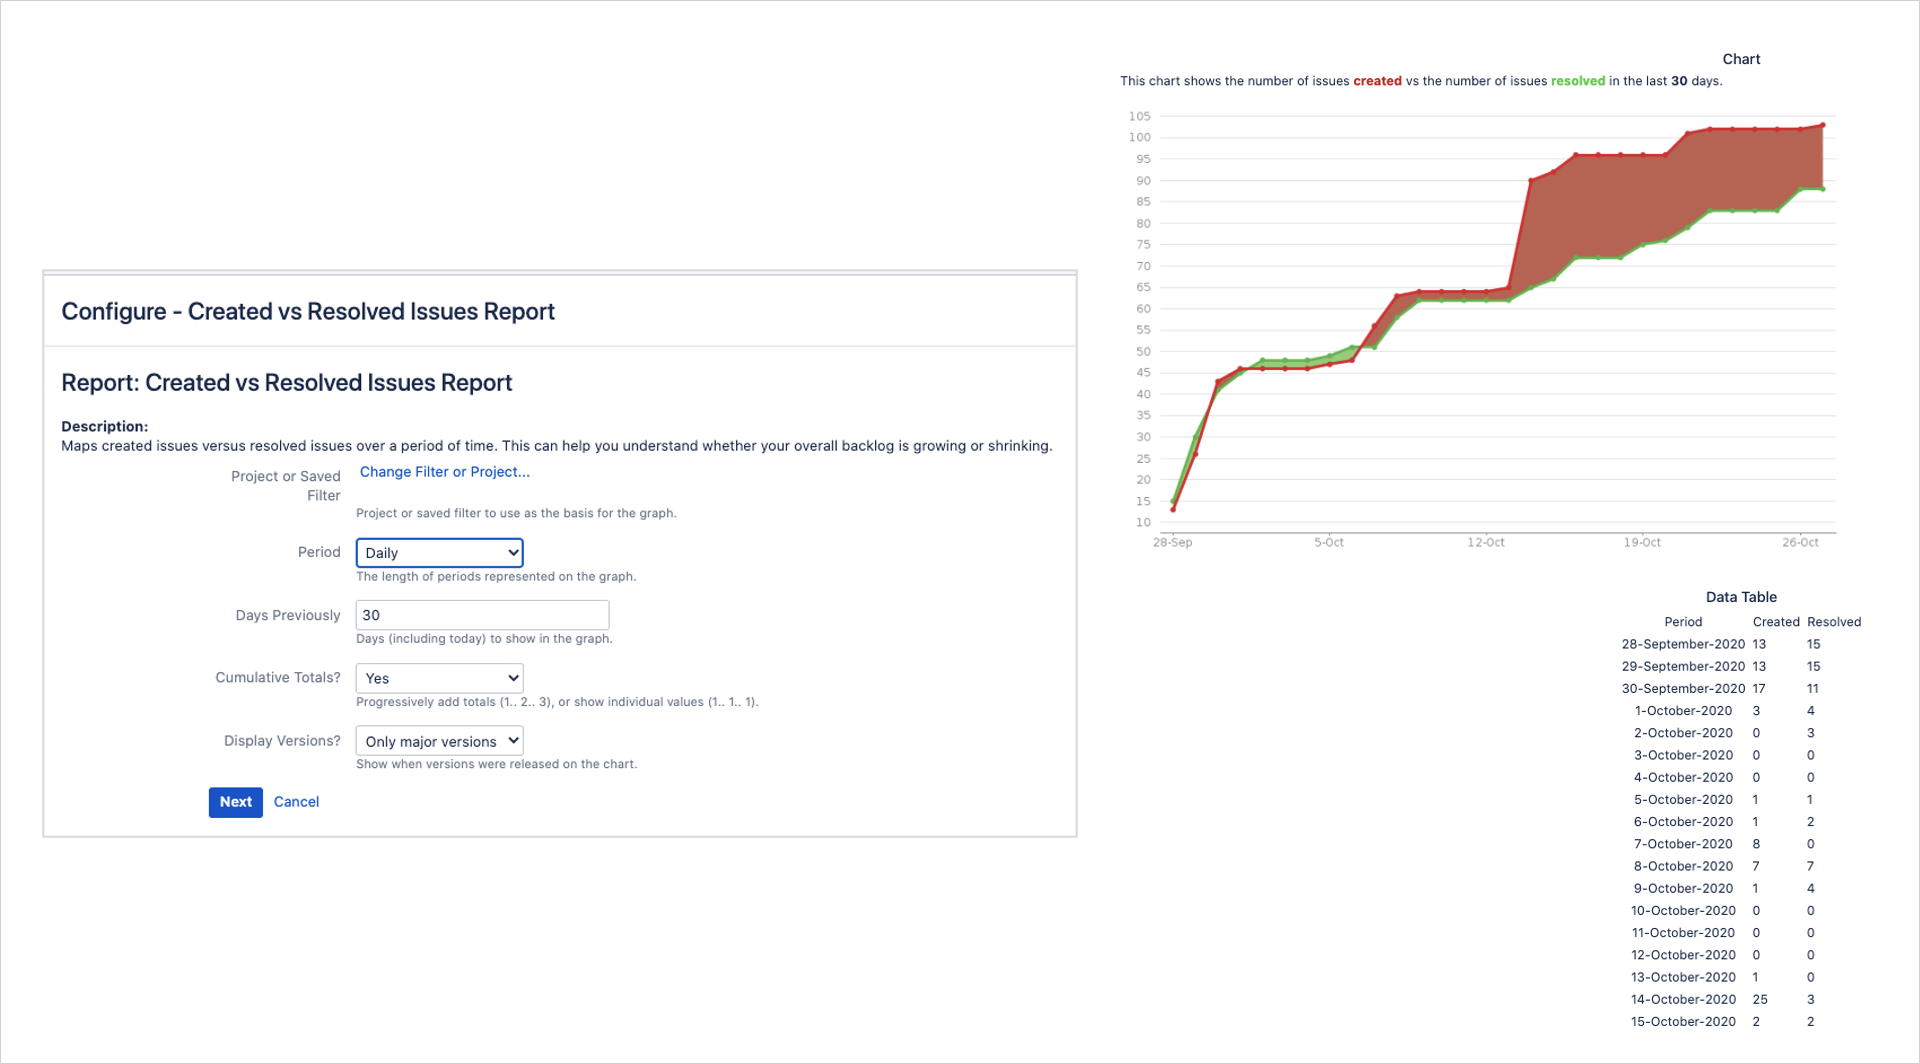
An example of how you can create a report in Jira that contrast the created issues against the resolved ones
Once inside a software-type project with a Kanban board configured, you will see two additional reports incorporated at the top: The cumulative report and the Control Chart report. Once again we advise you to check the Atlassian documentation for better understanding.
If you are familiar with Kanban, these reports are likely familiar to you. We want you to figure out from this blog the types of reports that are available to you, whether you use a Kanban board or a Scrum board, and that you understand the essential functions of each one to detect bottlenecks and measure delivery cycle times that allow you to adjust the flow in the best possible way.
 Jira offers an interesting variety of reports for Kanban software projects
Next, you can see the "Control Chart" report, where the "Cycle time" or "Lead time" is shown. Unlike previous reports, this graph can be configured directly in the report (time scale, necessary columns, filters, etc.) and allows you to inspect each point of the graph:
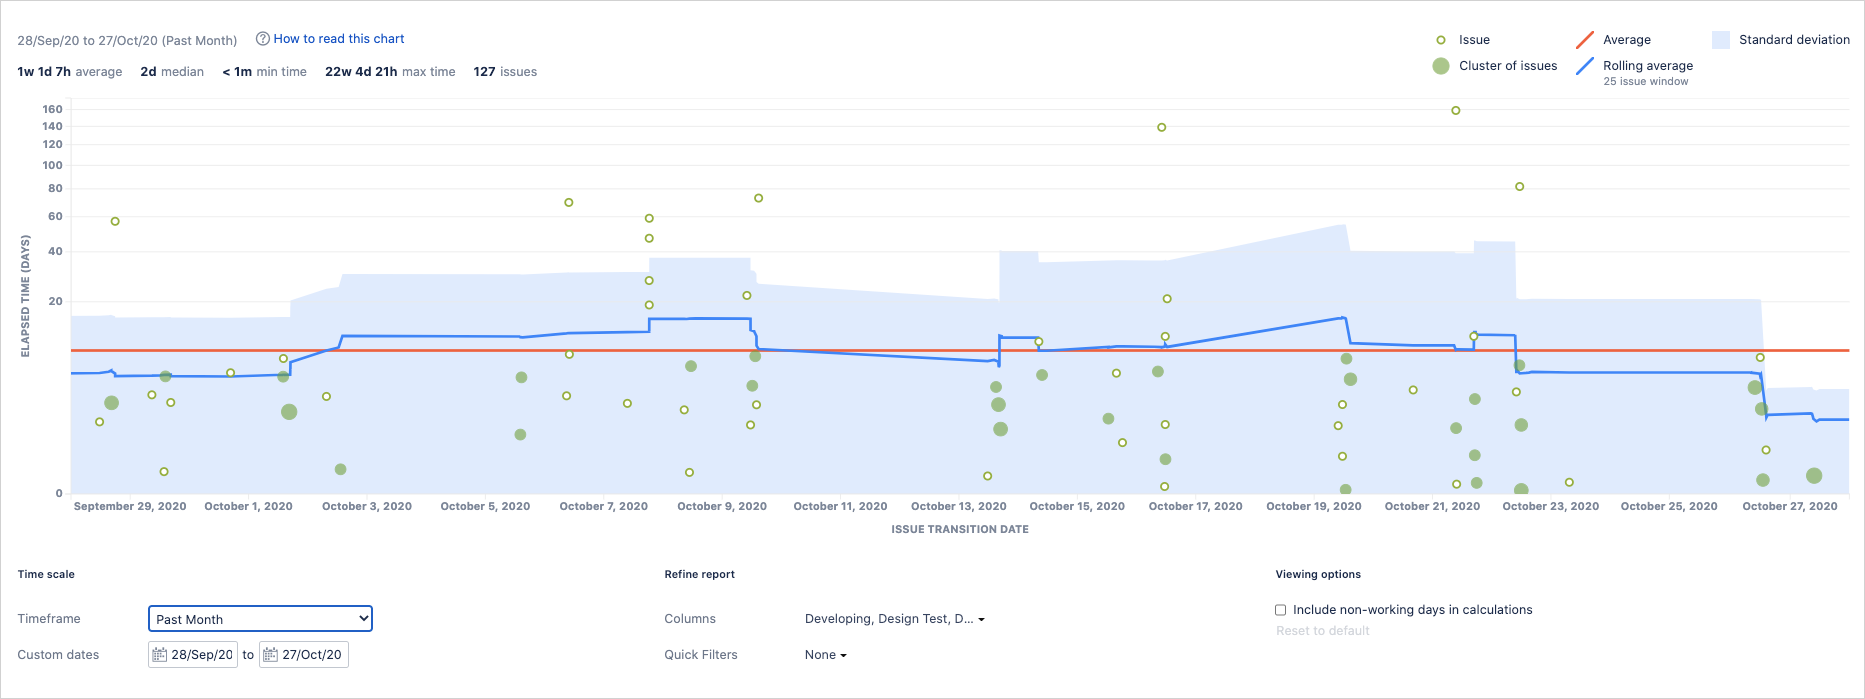
The Control Chart report shows the Cycle Time or the Lead Time
Same as with Kanban reports, once inside a software-type project that has a Scrum-type board configured, you will see that more reports are added at the top (there are also Kanban reports).
Scrum reports are intended to provide information on sprints or team speed, and even help us predict future sprints, based on estimates from past sprints (learn more about Scrum reports).
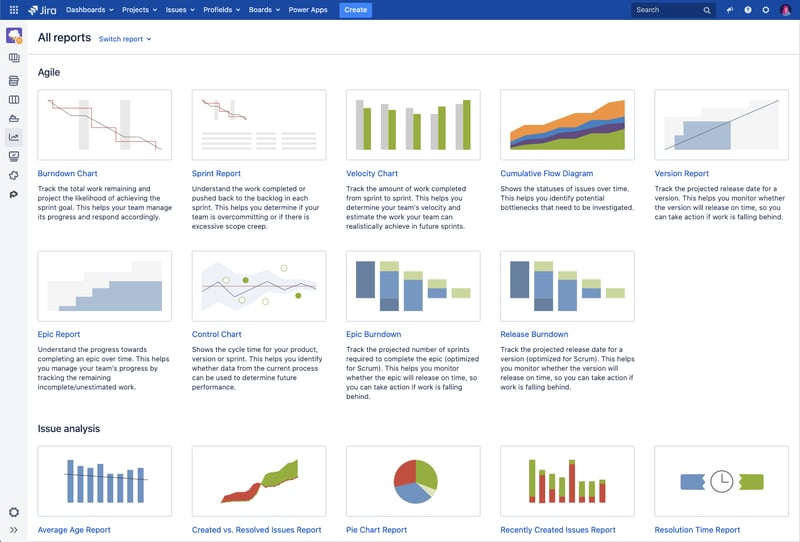 Here you can overview the variety of Scrum reports for software projects in Jira.
In the following, you can see an example of the Burndown report (if you are familiar with Scrum you may already know this graph), this graph allows you to see the evolution of the sprint, and if you look at the past, you will get a good summary of what has happened in each Sprint: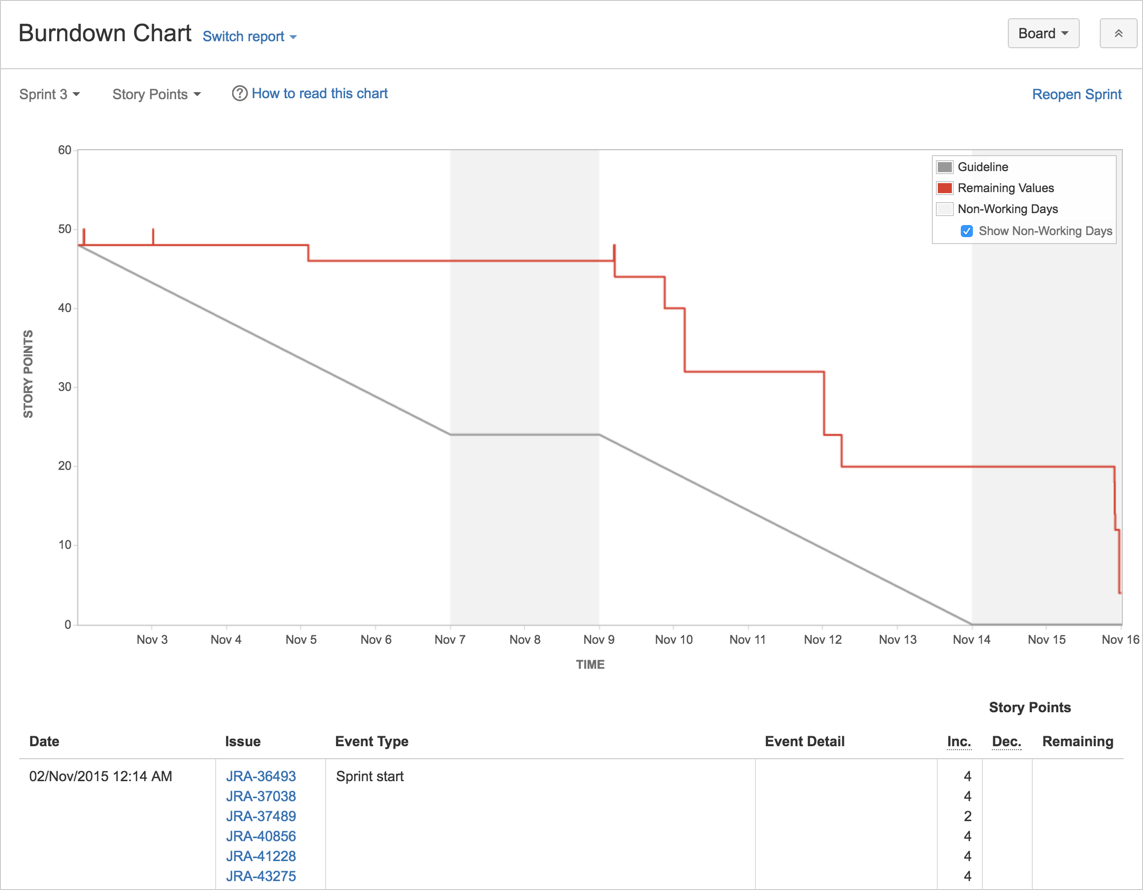
The Burndown Report allows to quickly check the Sprint evolution.
Before known as Jira Service Desk, this type of project report is intended to help support teams. Unlike reports for software projects, you can create new reports based on the SLAs defined in the projects.
Create reports for Jira Service Desk based on the SLAs you previously defined within the system
In this case, we can see a report of the resolution time averages by type of request:
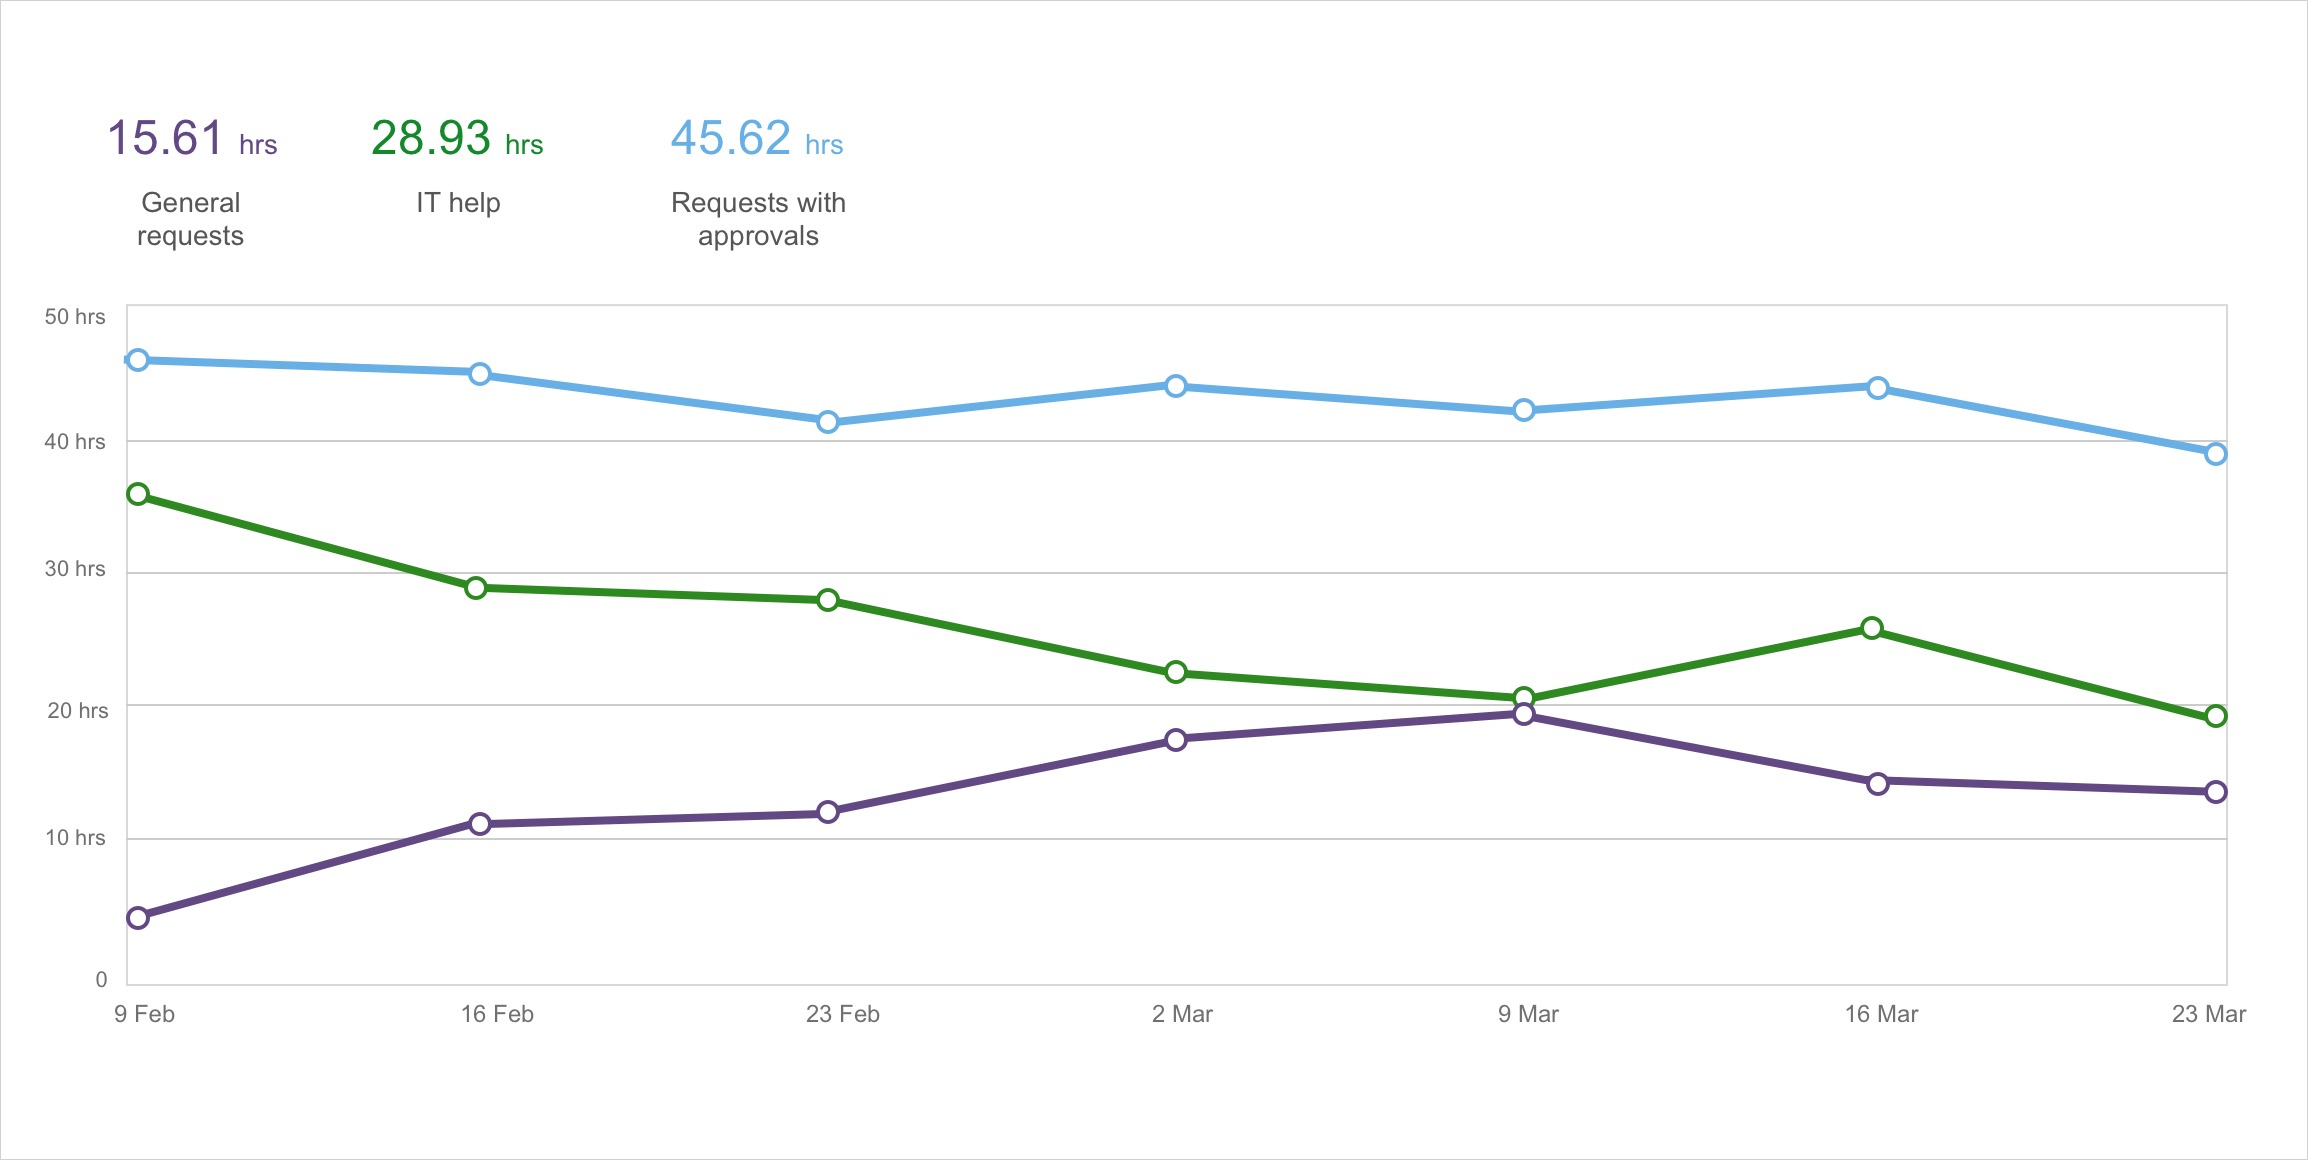 This report allows comparing different response times
As we mentioned at the beginning, it's usual to generate reports by exporting the information to an Excel sheet. Jira provides the feature to export to CSV, and Atlassian Marketplace apps such as Exporter, allow you to export to the native Excel format. In both cases, this export will always be at the issue level.
How to export Jira project reports to Excel? If you want to export the information of your projects created with Projectrak (formerly Profields), you can export to Excel all the information of your projects which will allow you to prepare the report you want (feature available in Projectrak Data Center).
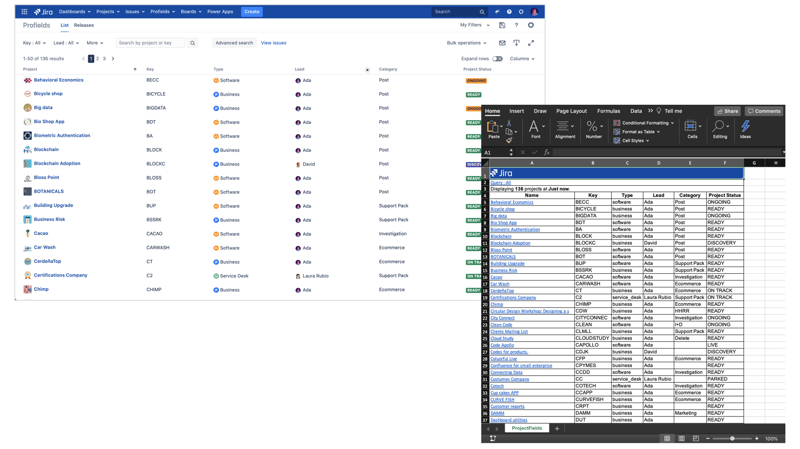 Projectrak (formerly Profields) allows exporting projects from Jira to Excel.
Together, the Jira dashboards and gadgets are one more way to get project information in Jira. However, this option has three characteristics that differentiate it from the rest of the reports that we have seen so far:
There is a directory of gadgets that allows users to add them to the dashboard and configure them to their taste. The availability of the different gadgets will depend on the Atlassian Marketplace apps present in the Jira instance. The directory looks like this:
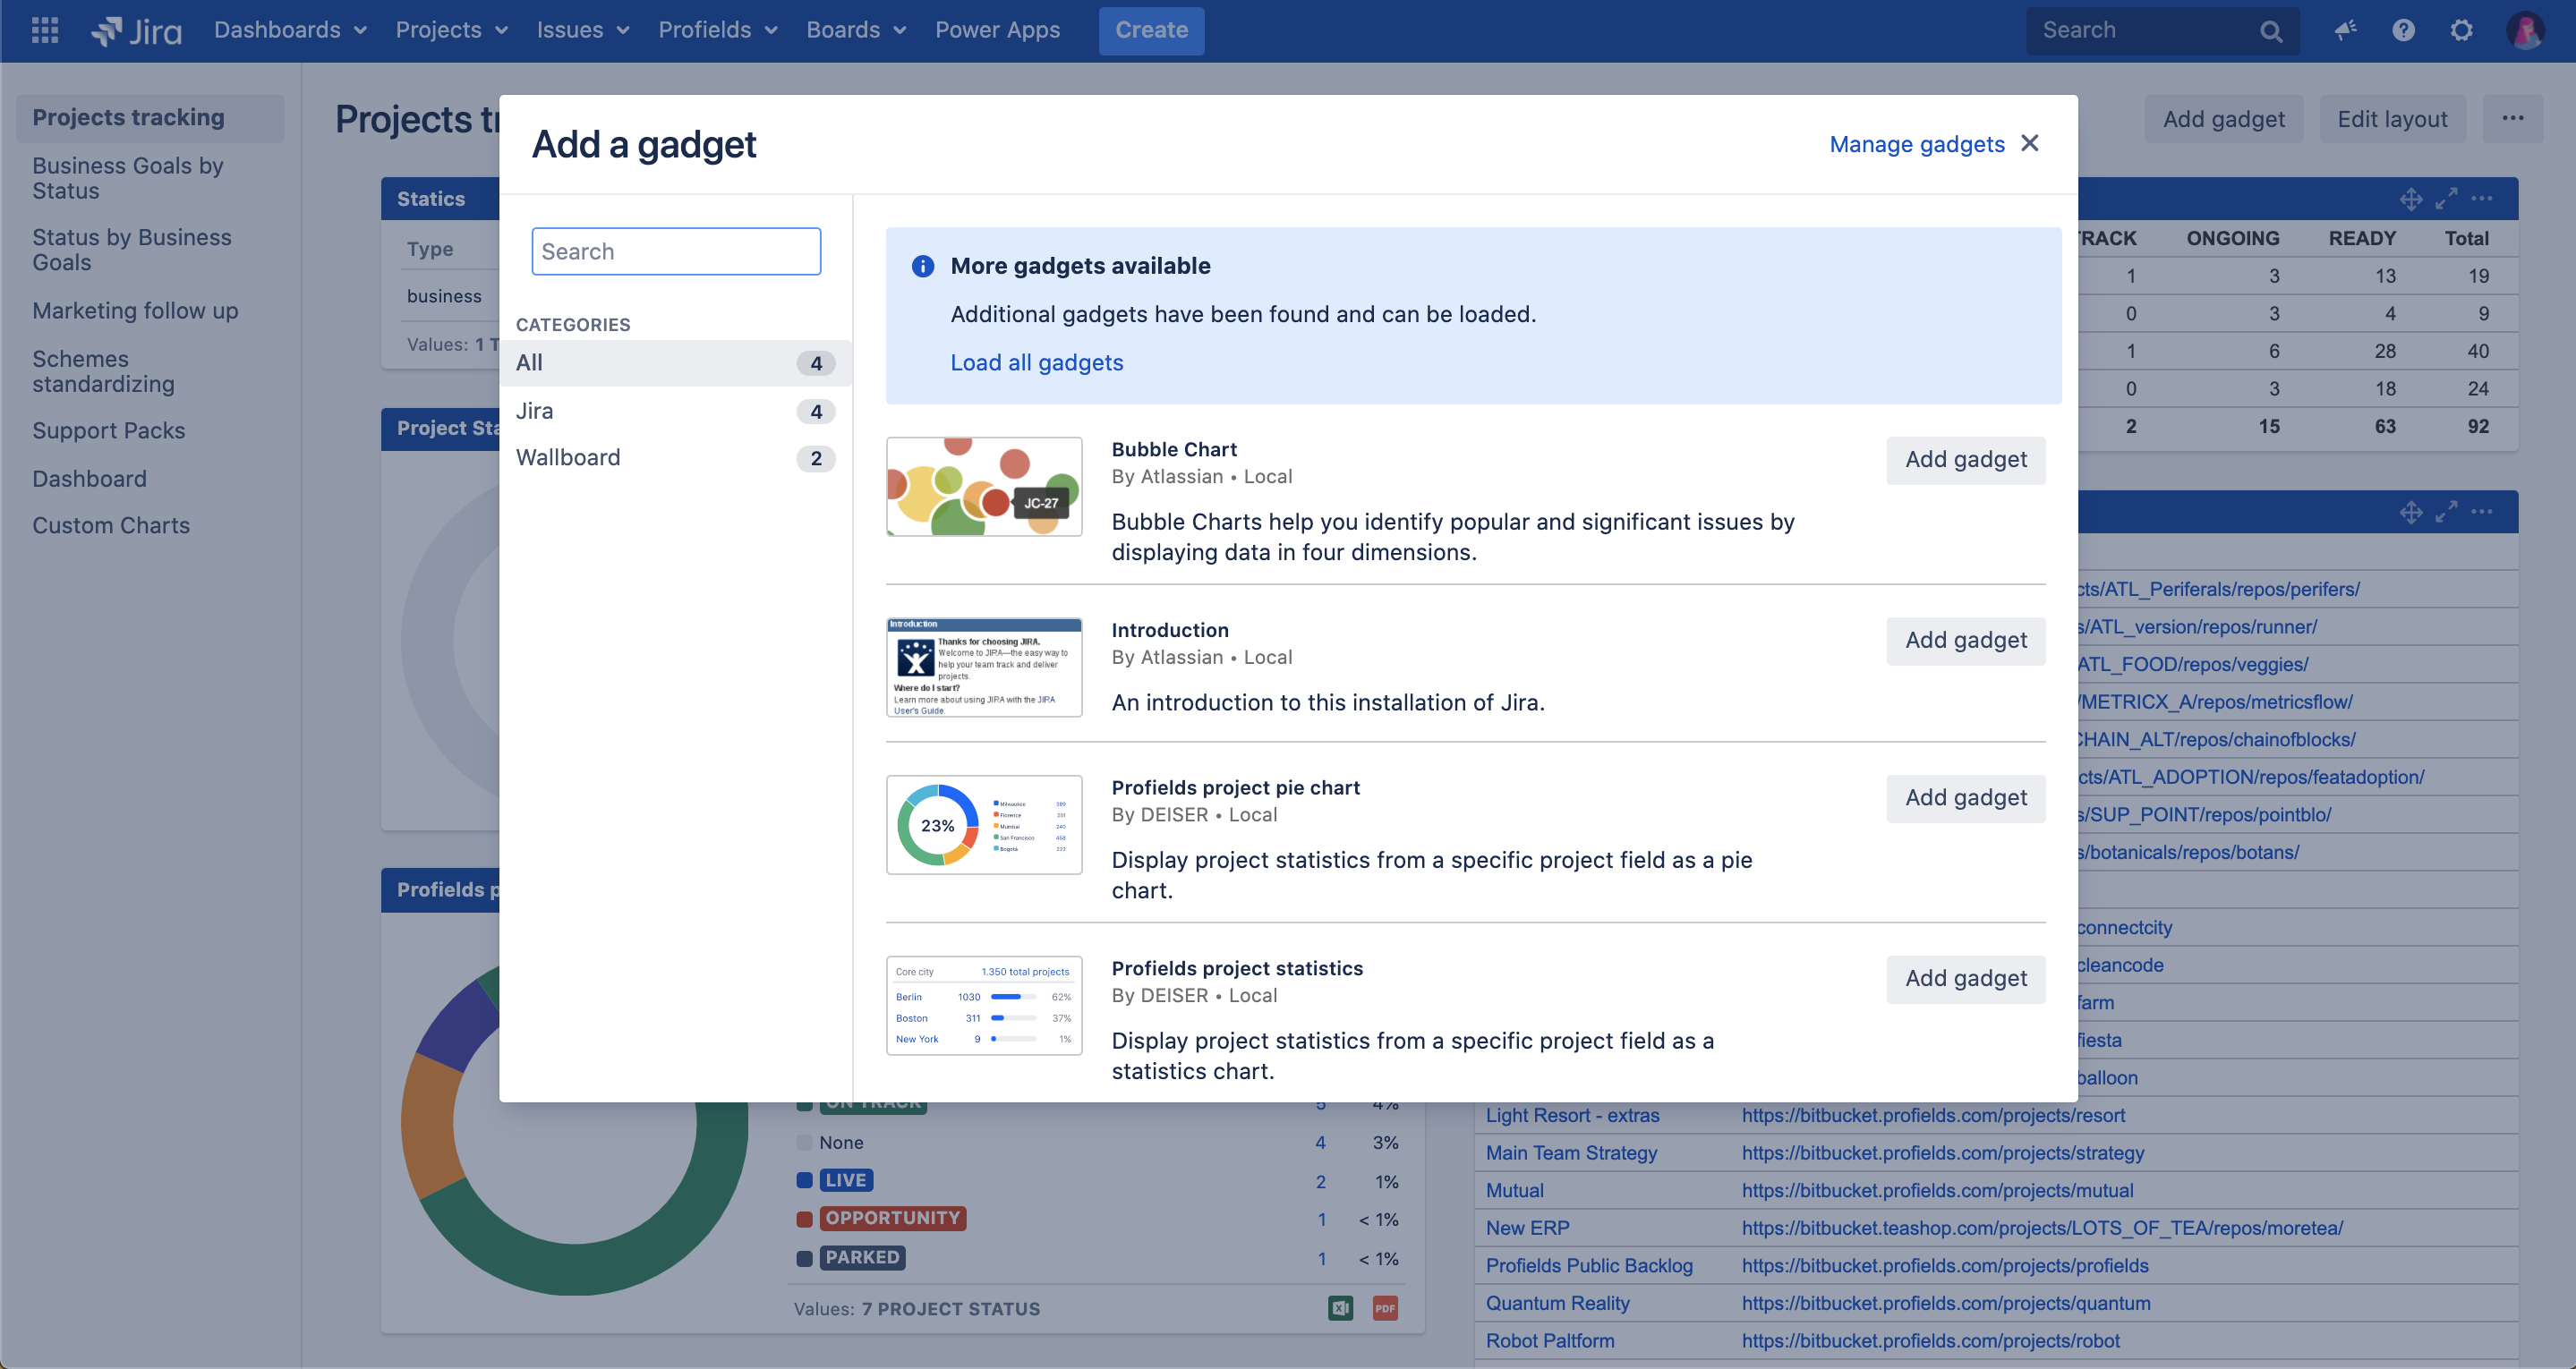
The gadgets directory is available from the upper right side of the Jira dashboards screen, from the "Add gadget" button
There are specific gadgets for Jira Software users that allow you to track Sprints. In addition, by default, Jira (Software, Service Desk, and Core) includes gadgets that return accumulated information from the issues.
On the other hand, some apps from the Atlassian Marketplace that help you keep track of your information in Jira also usually include gadgets, and they will be available in the directory mentioned above.
 Get specific statistics regarding your project information in Jira with Projectrak gadgets
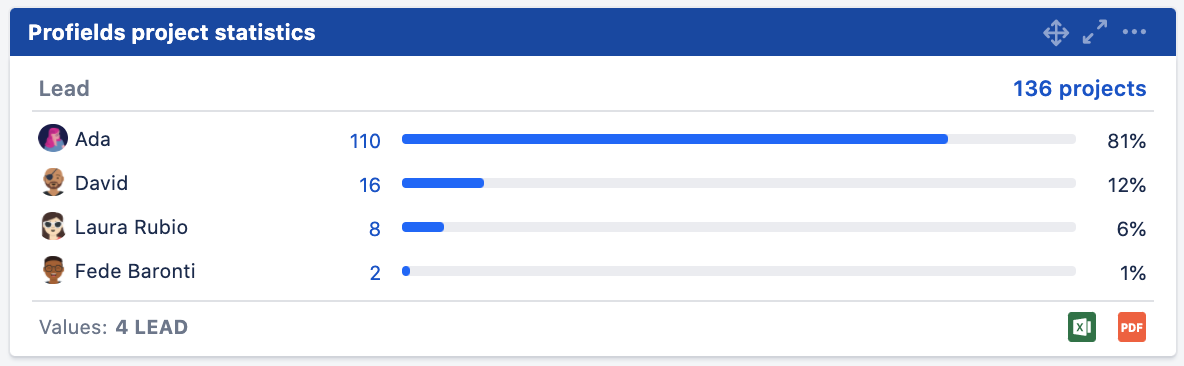
In the example below, you can see some of the gadgets that Projectrak include and allows you to see how the projects of your instance are divided by the project leader or by status:
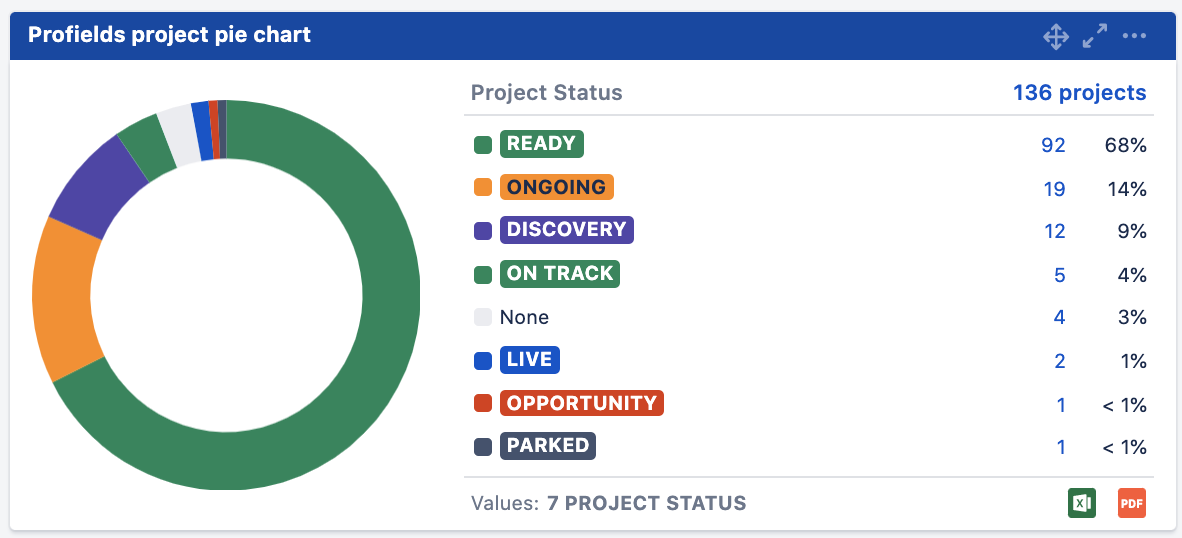
Get an interactive and overall view about specific aspects of your Jira projects
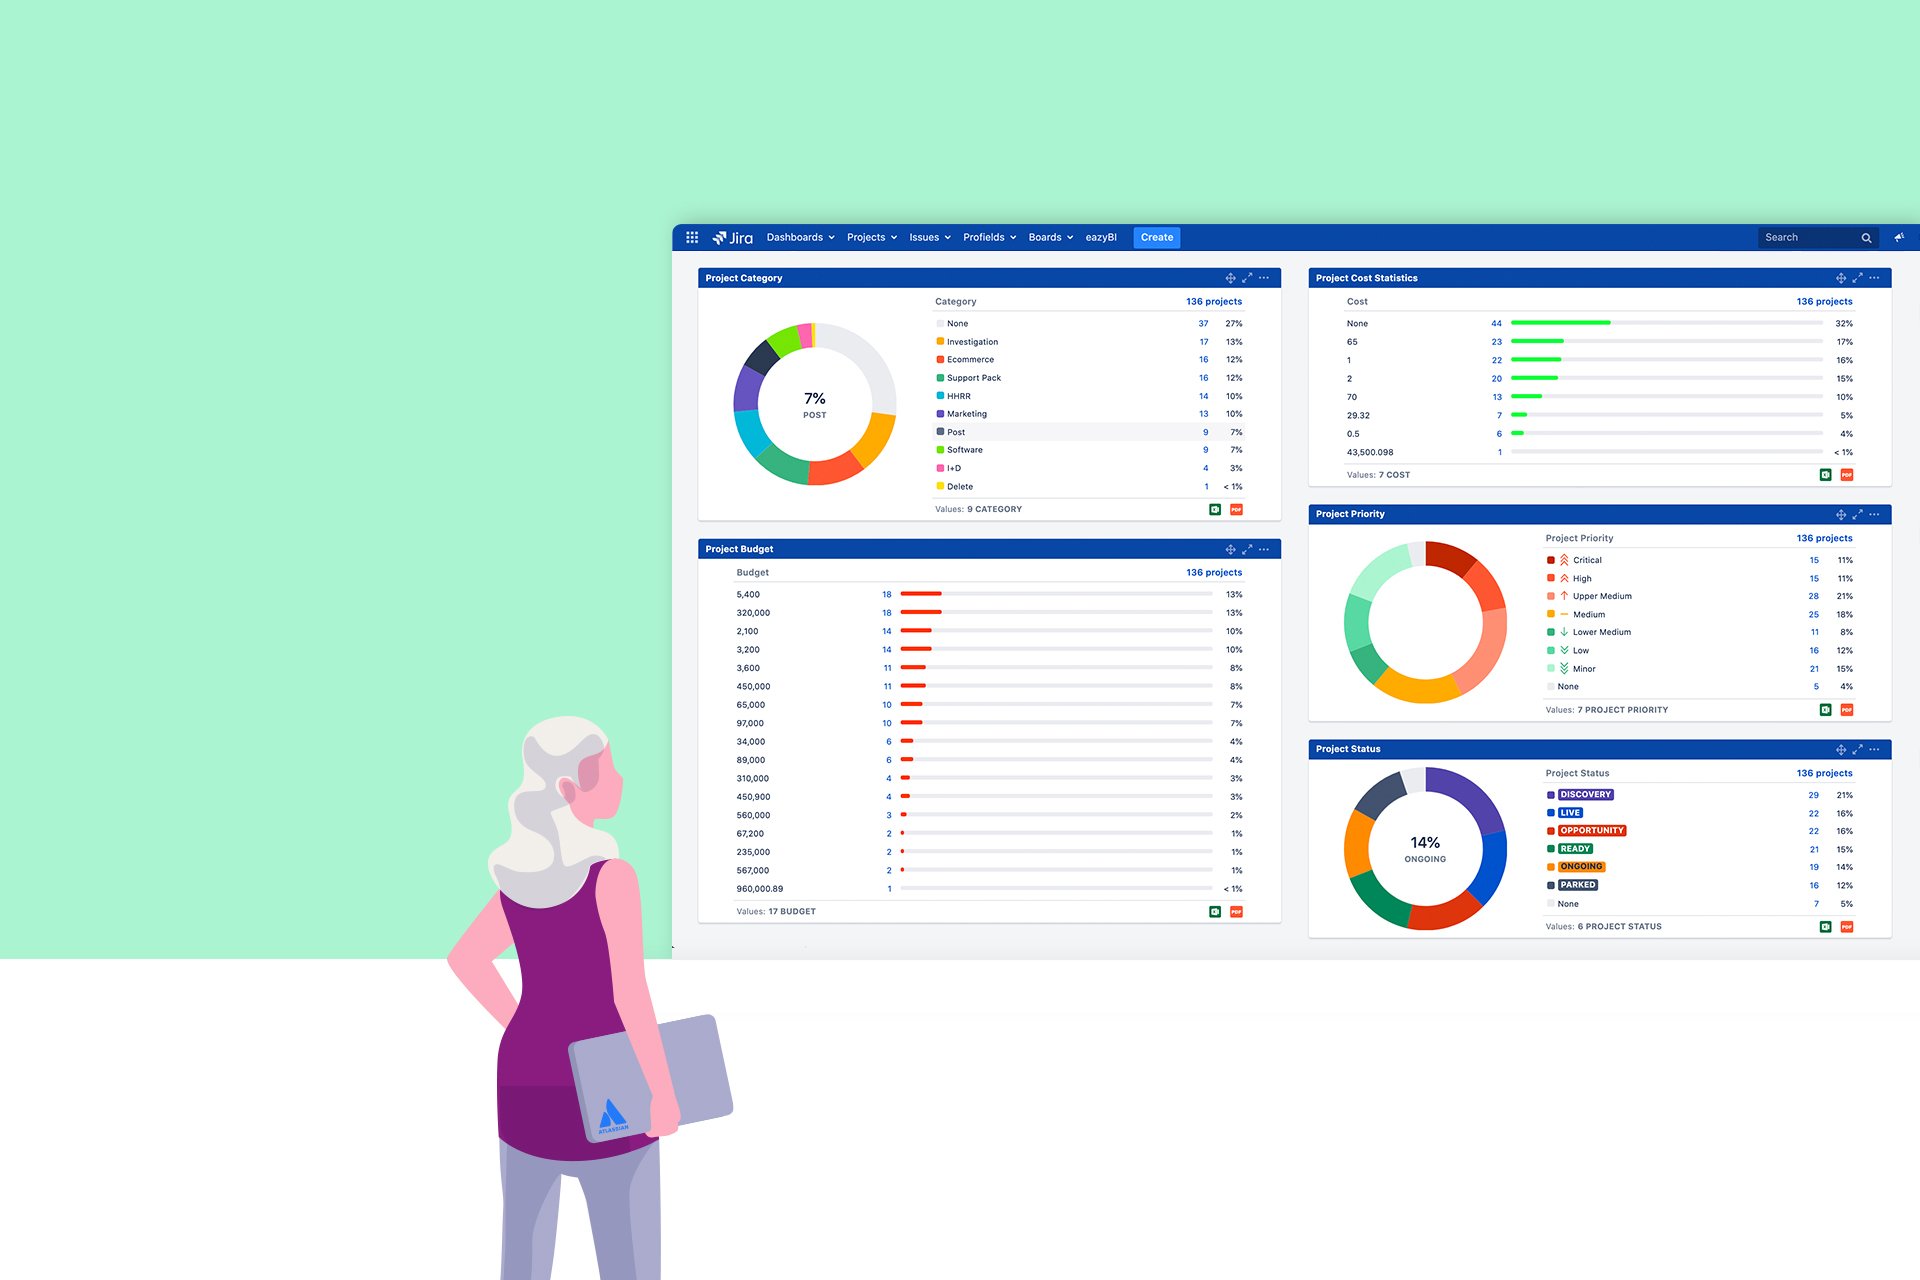
In short, you will be able to see the relevant information of your projects or products in Jira, through the dashboards configured with Projectrak gadgets, with each of the projects in which each user participates, for example, looks like this:
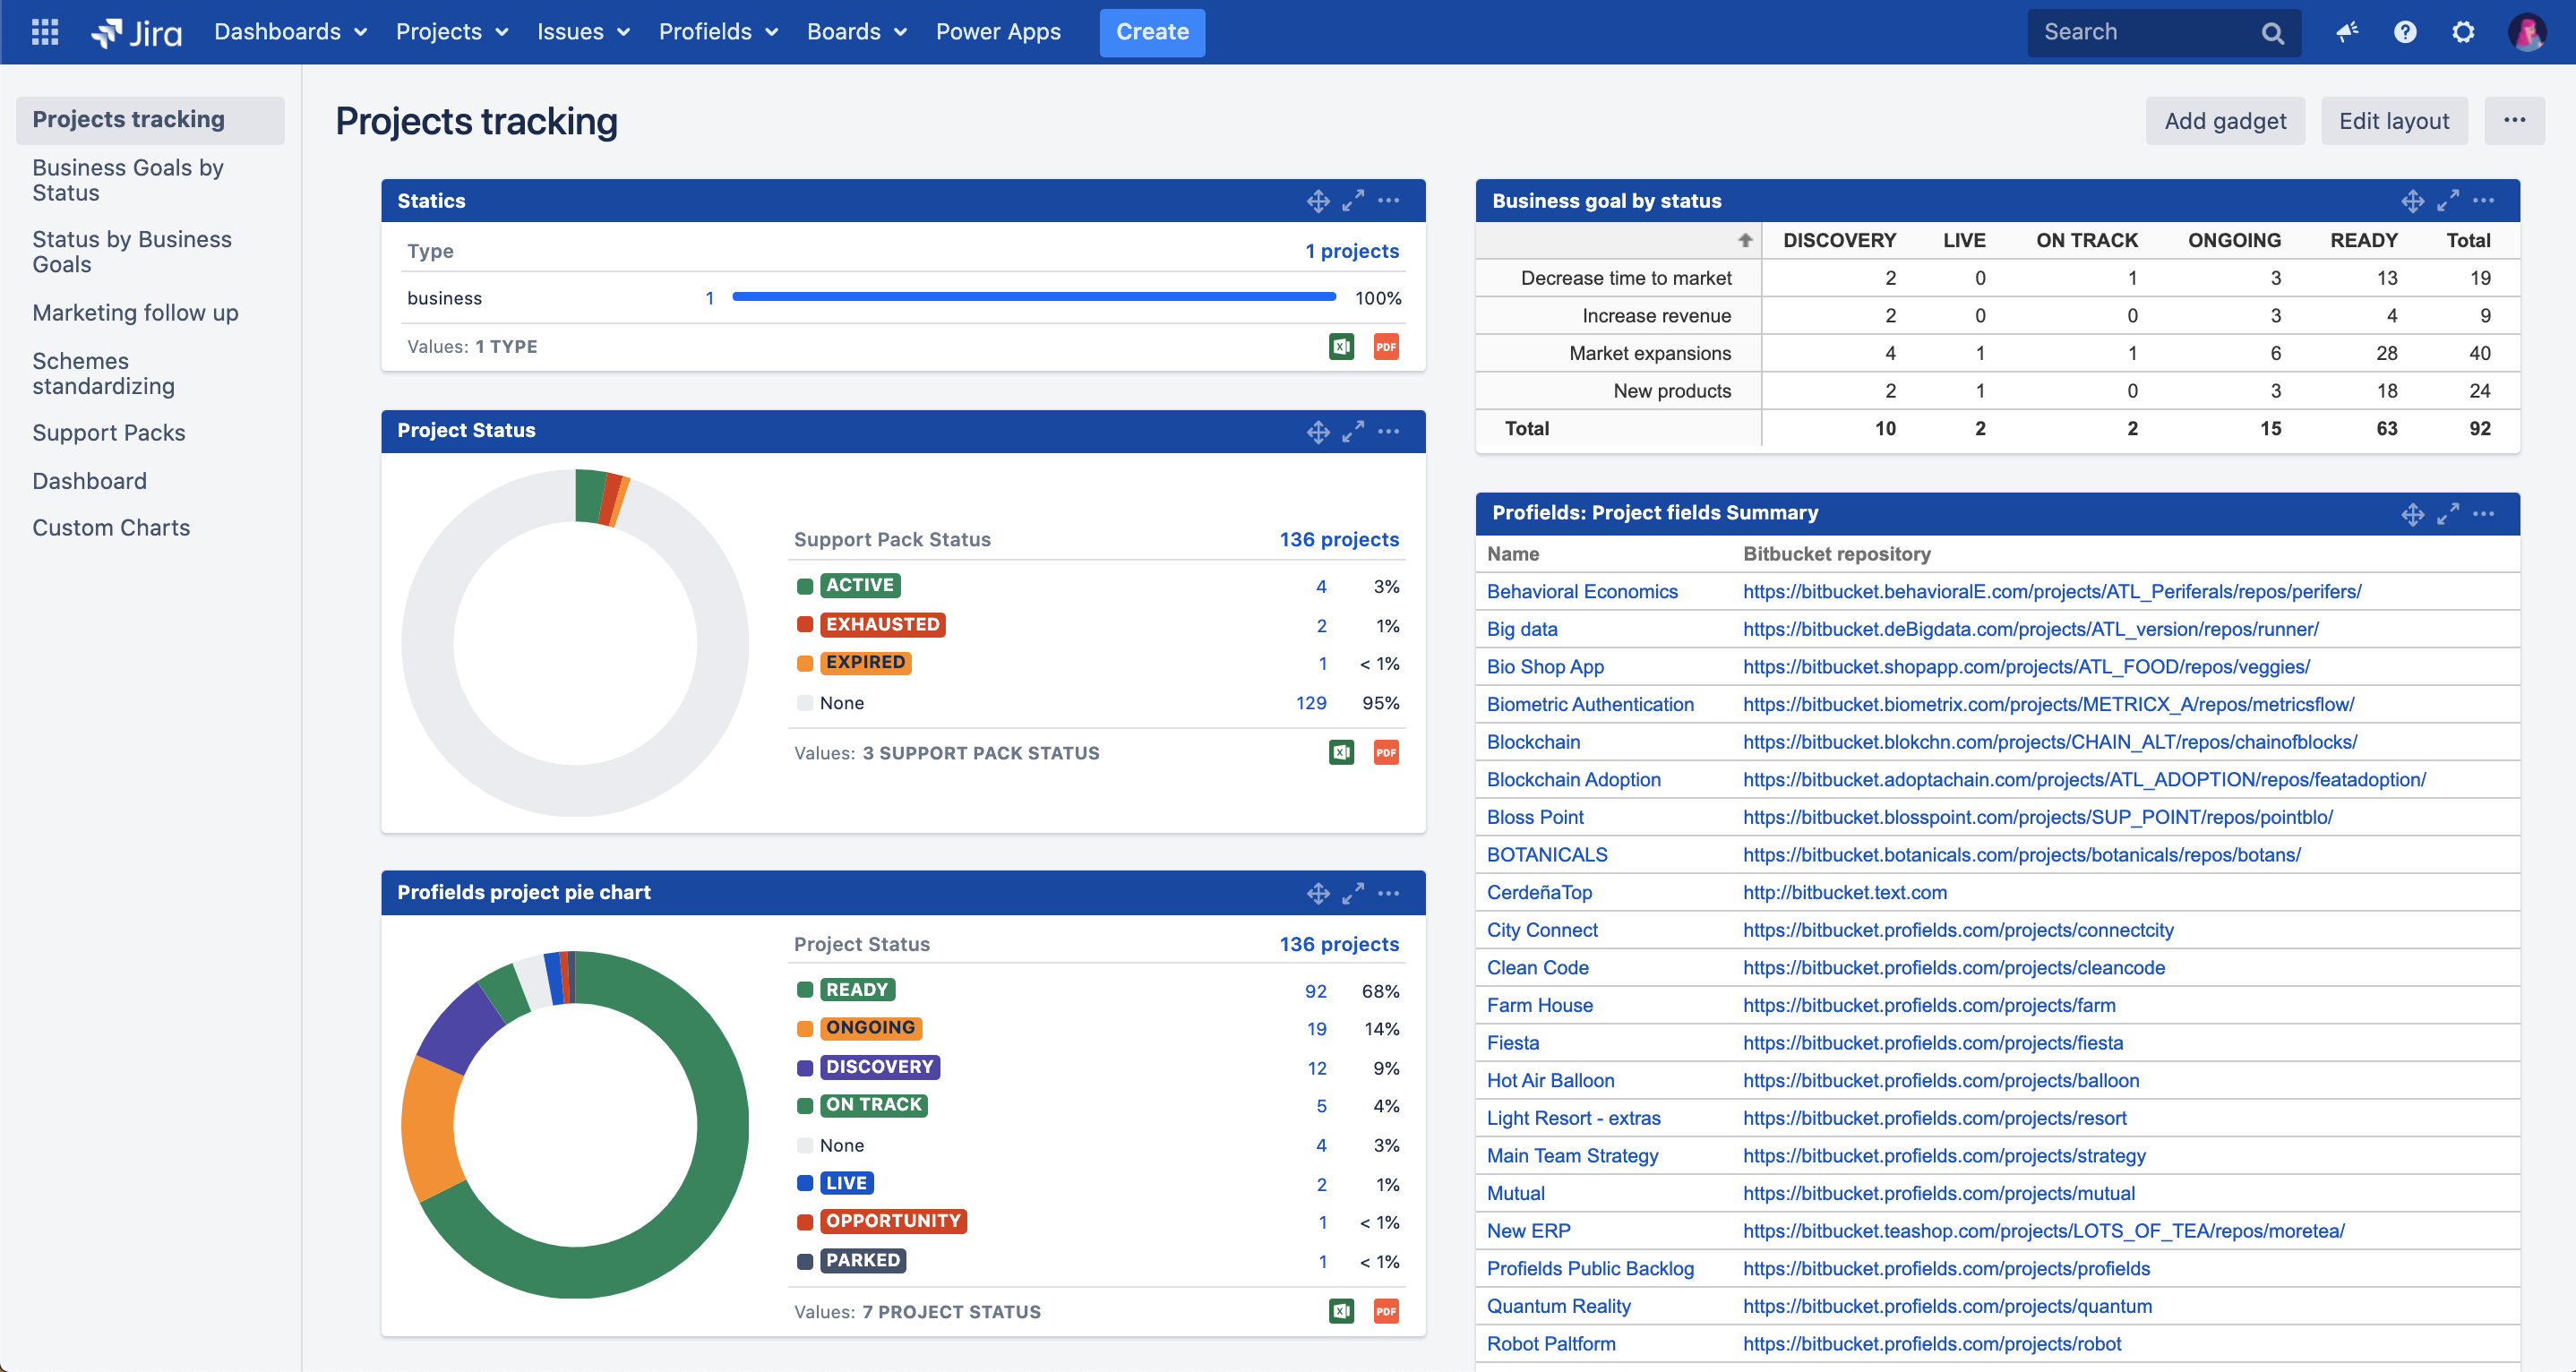
This is how your Jira dashboard might look, displaying all the project information you need to track at it best
Remember, the detail displayed about your projects in your Jira dashboards, will always depend on the variety of gadgets available in the directory (native or from Atlassian Marketplace apps), and the possibilities you have chosen to create and organize project information within Jira.
If you have come this far, we hope you are aware of the possibilities you have for creating reports in Jira.
Collaboration in this software tool is obvious and necessary. All the people who manage projects in Jira, in one way or another, have the possibility of extracting information for their daily, monthly, and quarterly monitoring, etc.
It's also important for you to know what type of reports to create in Jira, and where you can extract them, so it satisfies your project reporting and monitoring needs in the best possible way.
Last but not least, at the beginning of the article we discussed the possibility of making use of external tools. Although we have talked about Excel, we have left out the Business Intelligence (BI) tools. If you want to go deeper into this, we recommend you read more about the project reports you can get by using eazyBI and Projectrak. Below you'll find a rough guide we made a couple of years about Jira project reporting.


No Comments Yet
Let us know what you think