

Having a software tool that offers accessibility to project reports is a useful resource. Especially for those who need greater visibility of the teamwork evolution, or for a team member who needs to get an overview of team projects development, in any case, users with access to the Jira Cloud dashboards could have this type of visibility. In this post, we will show you which type of project information and project statistics you can display with Projectrak for Jira Cloud gadgets.
Usually, managers, project managers, and/or Product Managers are the profiles interested in having the big picture of the work, to obtain reports and statistics; and projects are the unit of measure that best suits for this type of visibility. Obtaining reports in Jira Cloud at the project level allows grouping information in a general way, and at the same time, allows to dig deeper (at the task level, in the case of Jira) as much as necessary, if needed (learn how to import project information from Jira to Power BI).
Learn how to get the list with all the project historical changes with Projectrak >>
For these reasons, the Projectrak Cloud team works on developing mechanisms to generate project reports, in addition to other features (those of major relevance to users), with the vision of achieving feature parity with those that already exist in the Projectrak Data Center version.
Before explaining how you can get project information in the Jira Cloud dashboards, with Projectrak gadgets, let's review some concepts:
If you are a Jira user, you are probably already familiar with Jira's default Gadgets and Dashboards, otherwise, we have already explained it to you before. The purpose of these elements will allow you to closely observe the development of your issues, and in the case of the Gadgets that Projectrak incorporates, that of your projects.
Projectrak Data Center version includes five different types of Gadgets, and the Cloud version, includes (so far), two of the most used by the users of the app: the "Two-Dimensional Gadget" and the "Pie Chart Gadget". We're going to tell you more about them below:
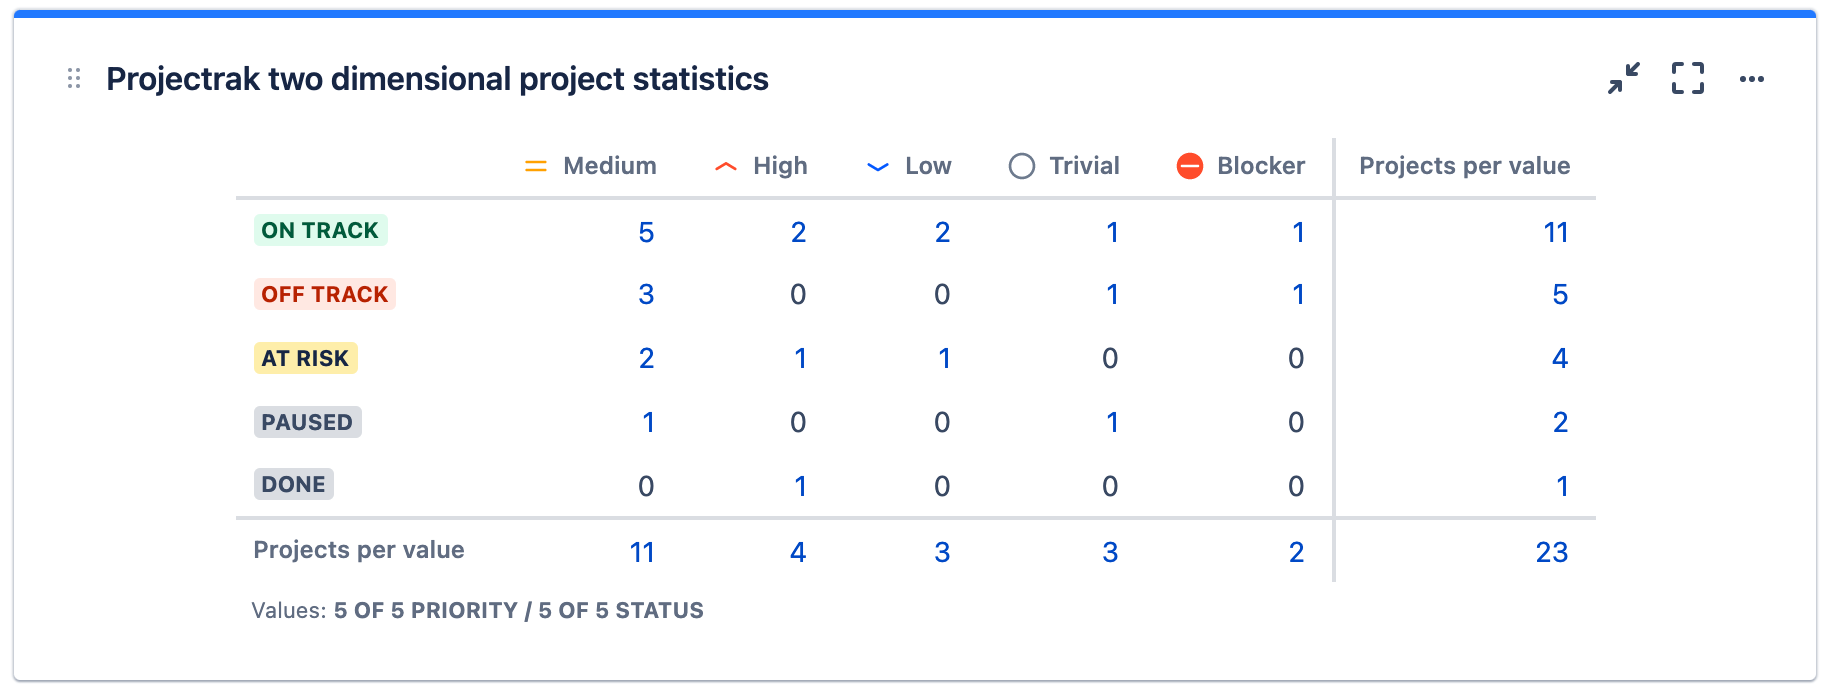
The Two-Dimensional gadget allows you to group project information on two axes, and calculate the totals for each combination of values you choose. For example, in the image we can see that the graph indicates that we have 5 projects in progress ("On Track") with a "Medium" priority:
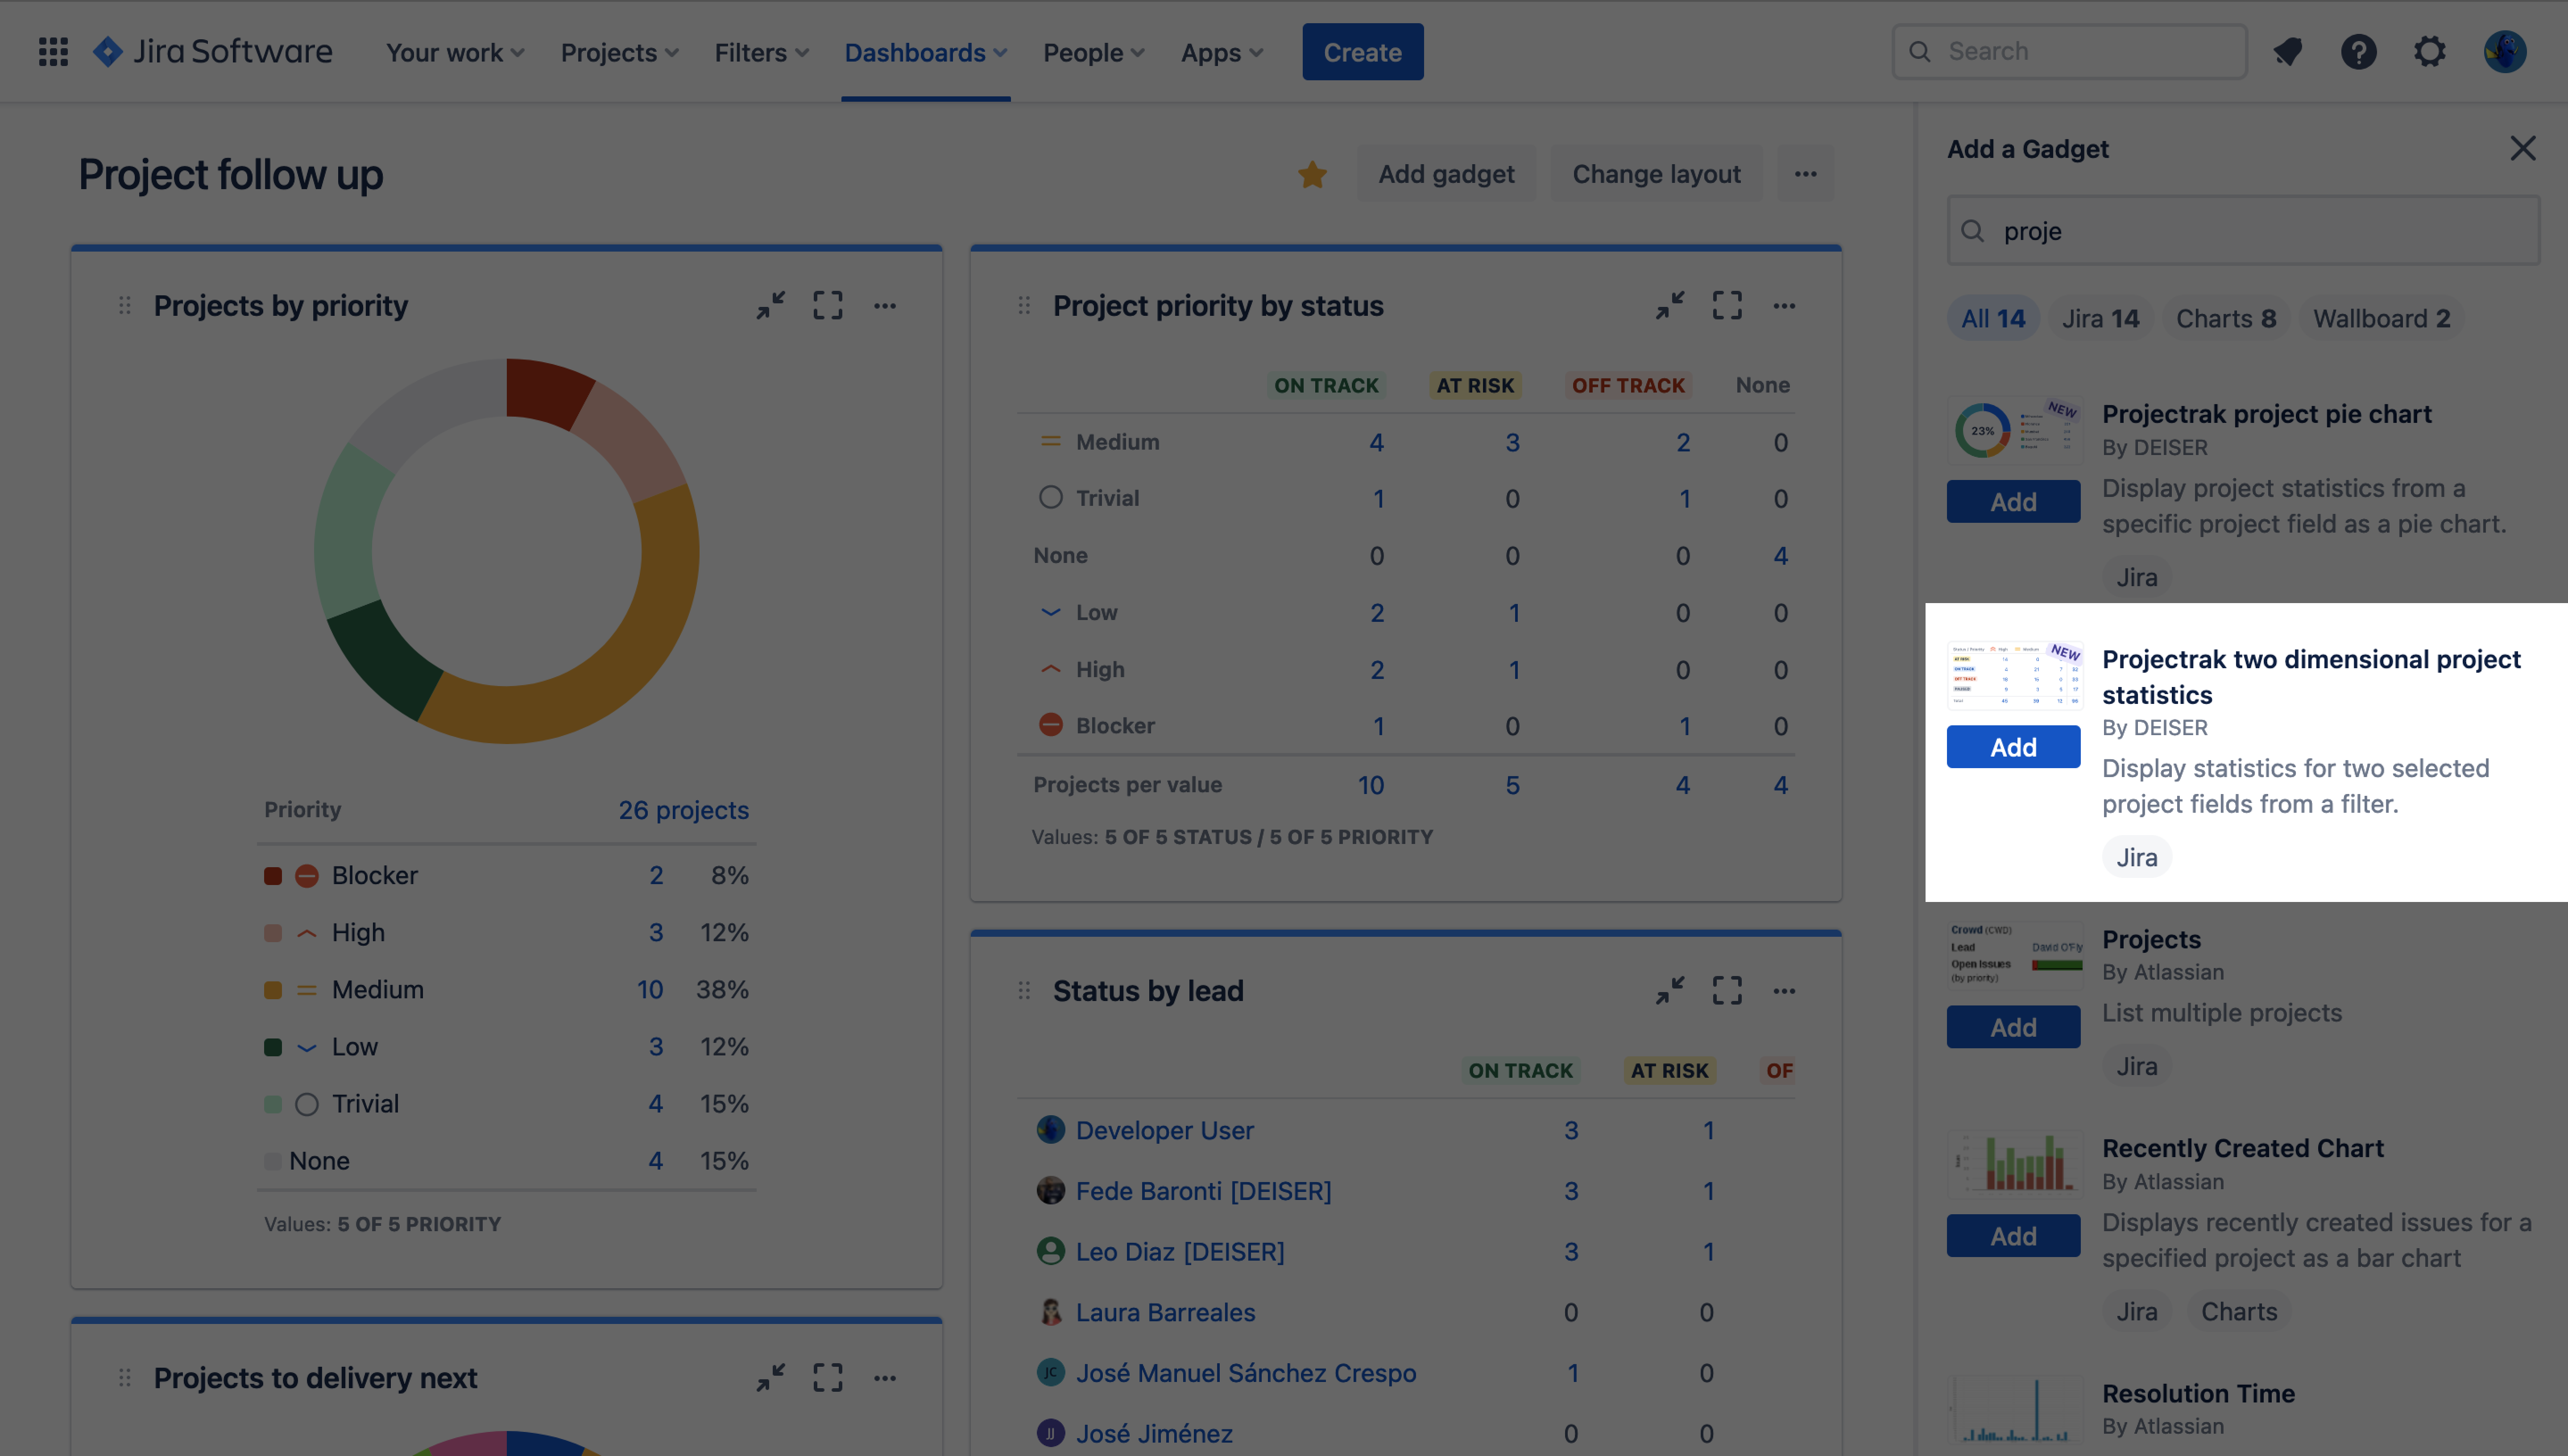
First of all, make sure you've editing permissions in the Jira Dashboard you're working with. That's, where you are allowed to add a new gadget. In this case, search in the Jira gadget directory for the Projectrak gadget "Two-dimensional project statistic", select it:
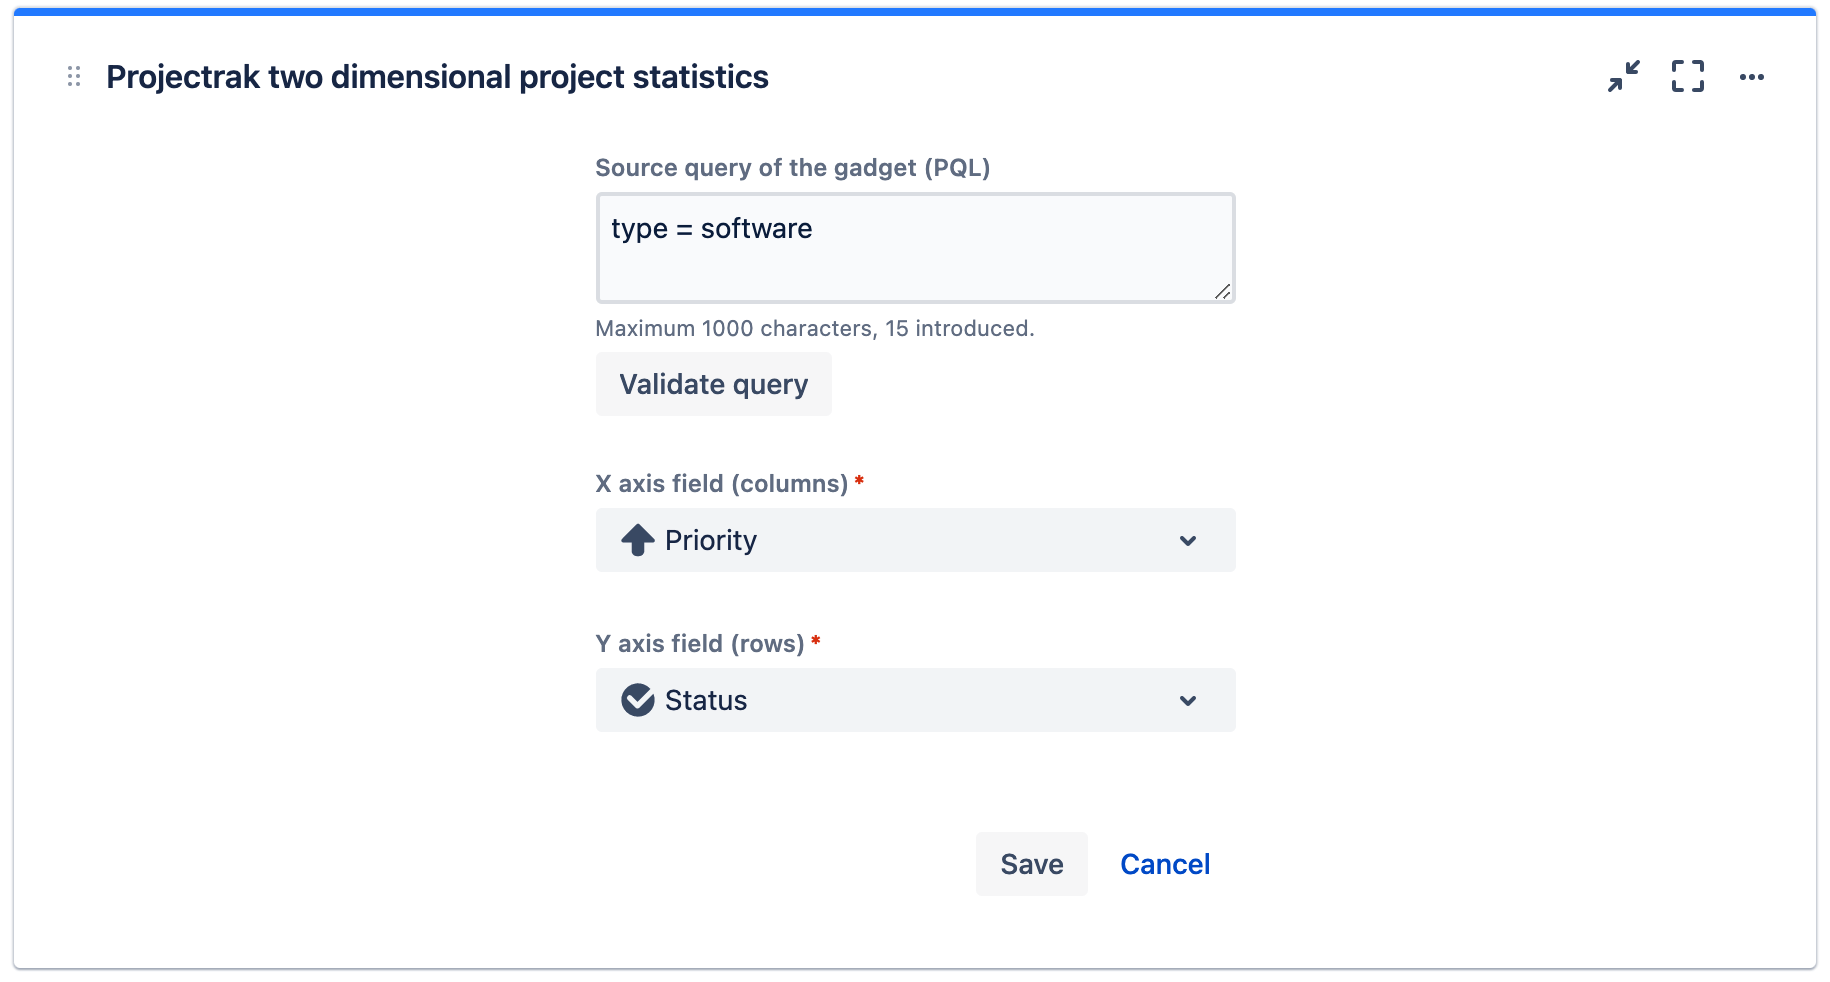
Once added to the Jira Dashboard, you have to configure it. To do this, you will be able to configure the PQL query with the project information you want to view and the fields you want to illustrate on each axis:
Once you have configured the Gadget, you will see the final result, similar to the table with the fields defined in each axis and the total projects where there is the combination of values you were probably looking for that we showed you at the beginning. Now you can start analyzing the report!
Projectrak users need reports and that is why we offer these Gadgets, in addition to the possibility to integrate with other reporting apps such as eazyBI, Custom Charts, Dashboard Hub, or Power BI connectors. Here are some of the benefits offered by some of the uses of this gadget:
This gadget allows you to categorize the projects based on a project field, calculating how many projects exist in each of the values.
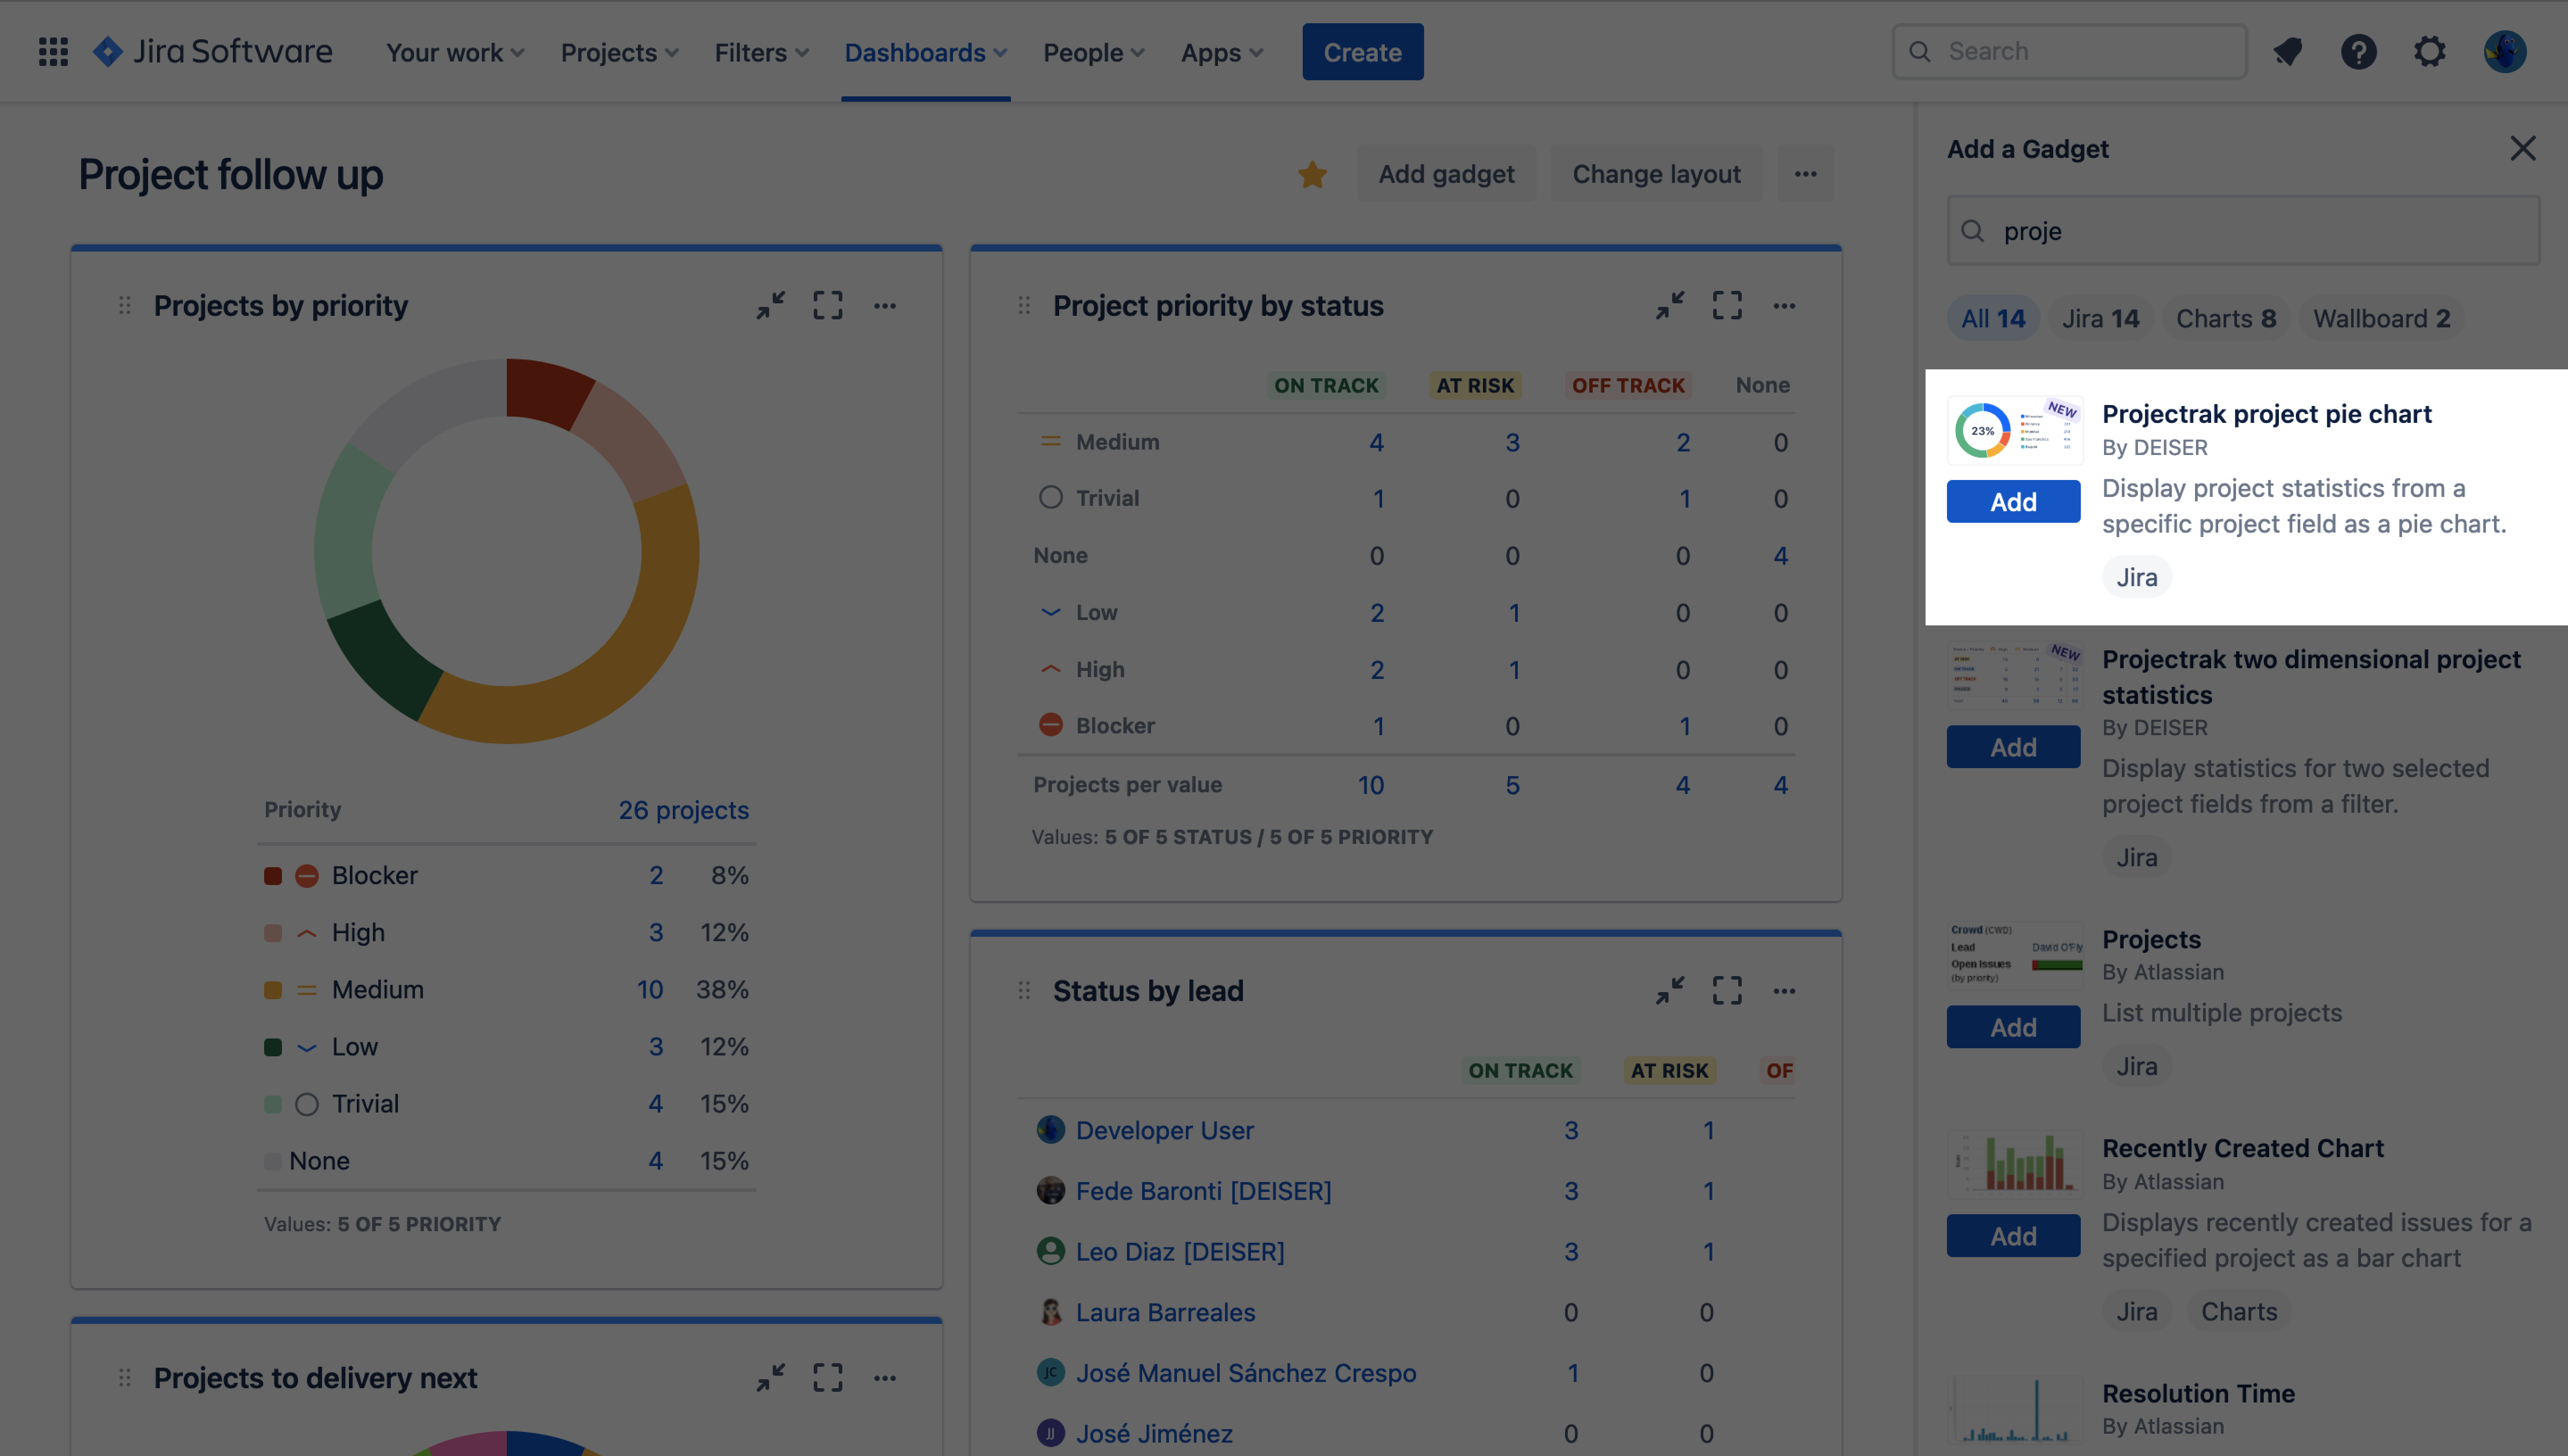
To begin with, make sure that you are in a Jira Dashboard with editing permissions. That's one that allows you to add a new gadget. In this case, you will look in the Jira gadget directory for the Projectrak gadget, the "Pie Chart Gadget", and select it:
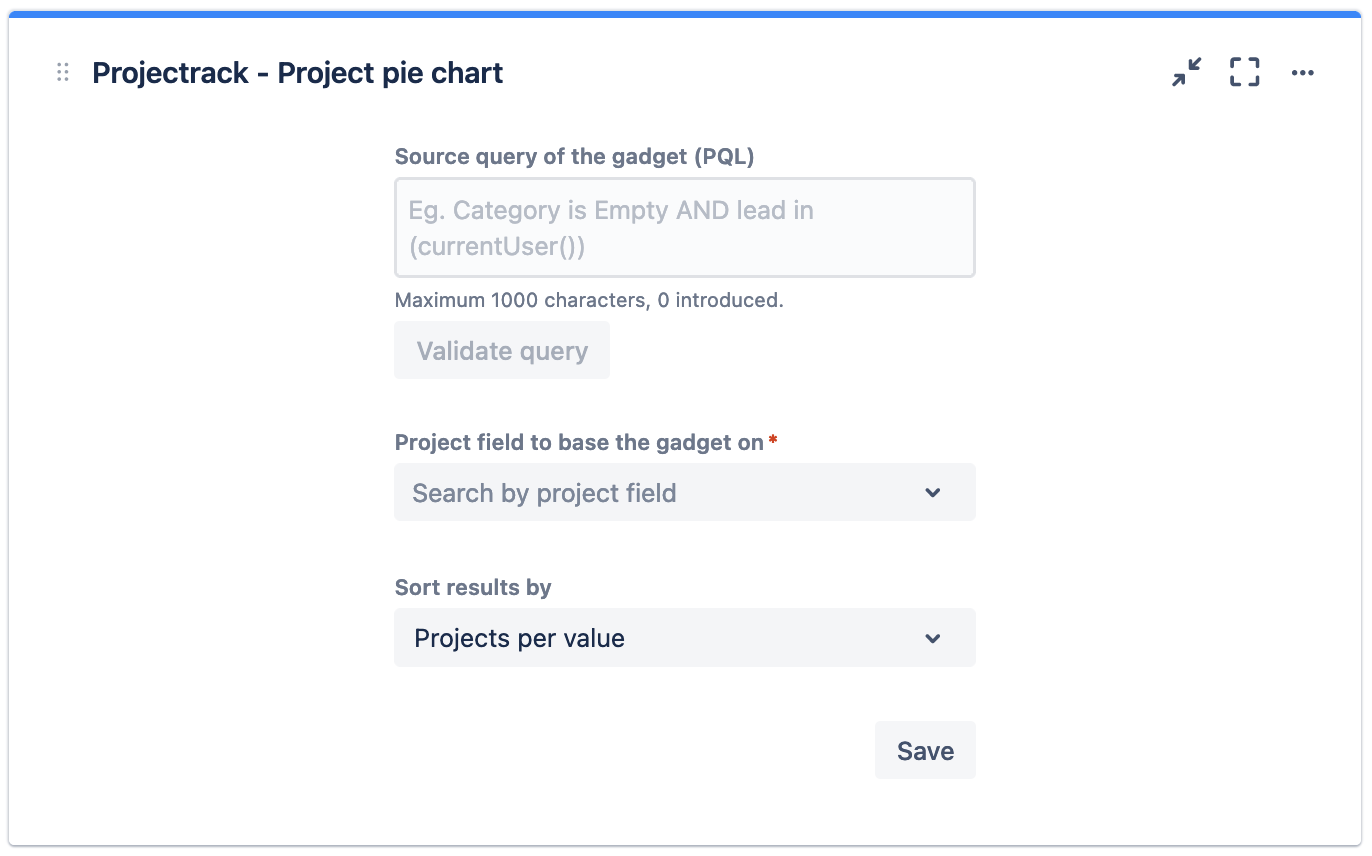
Configure the PQL query with the projects you want to query and the field you want to categorize them by:
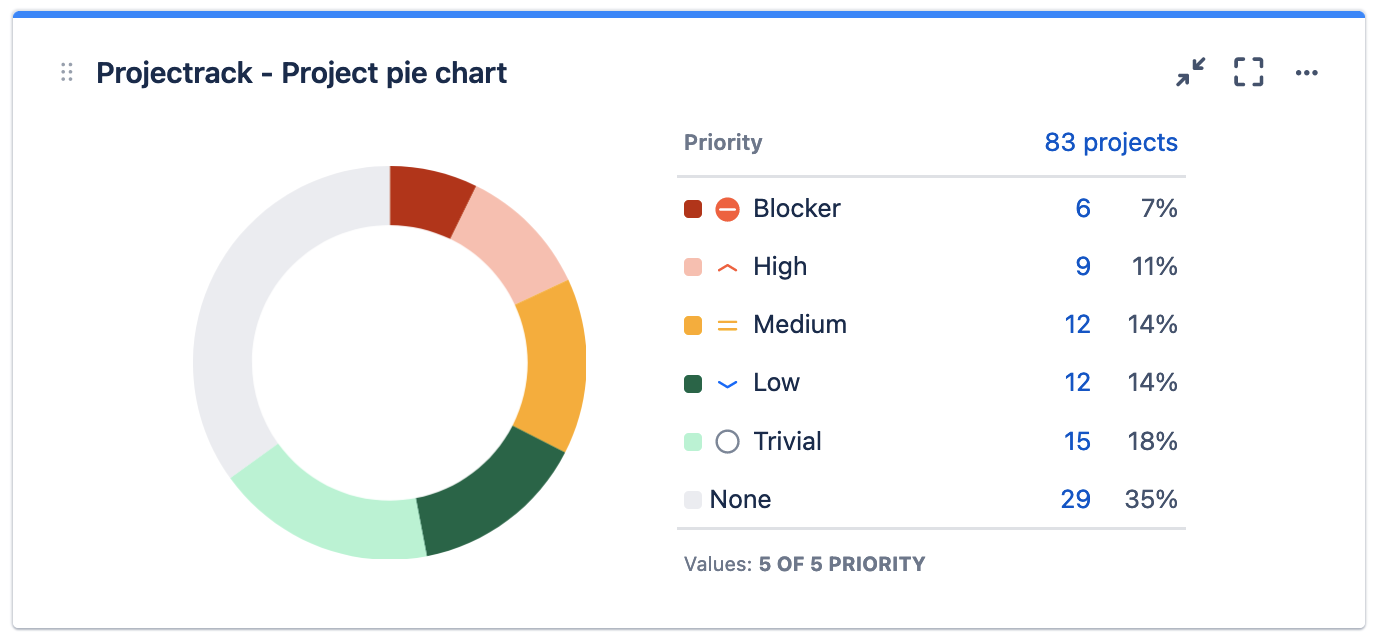
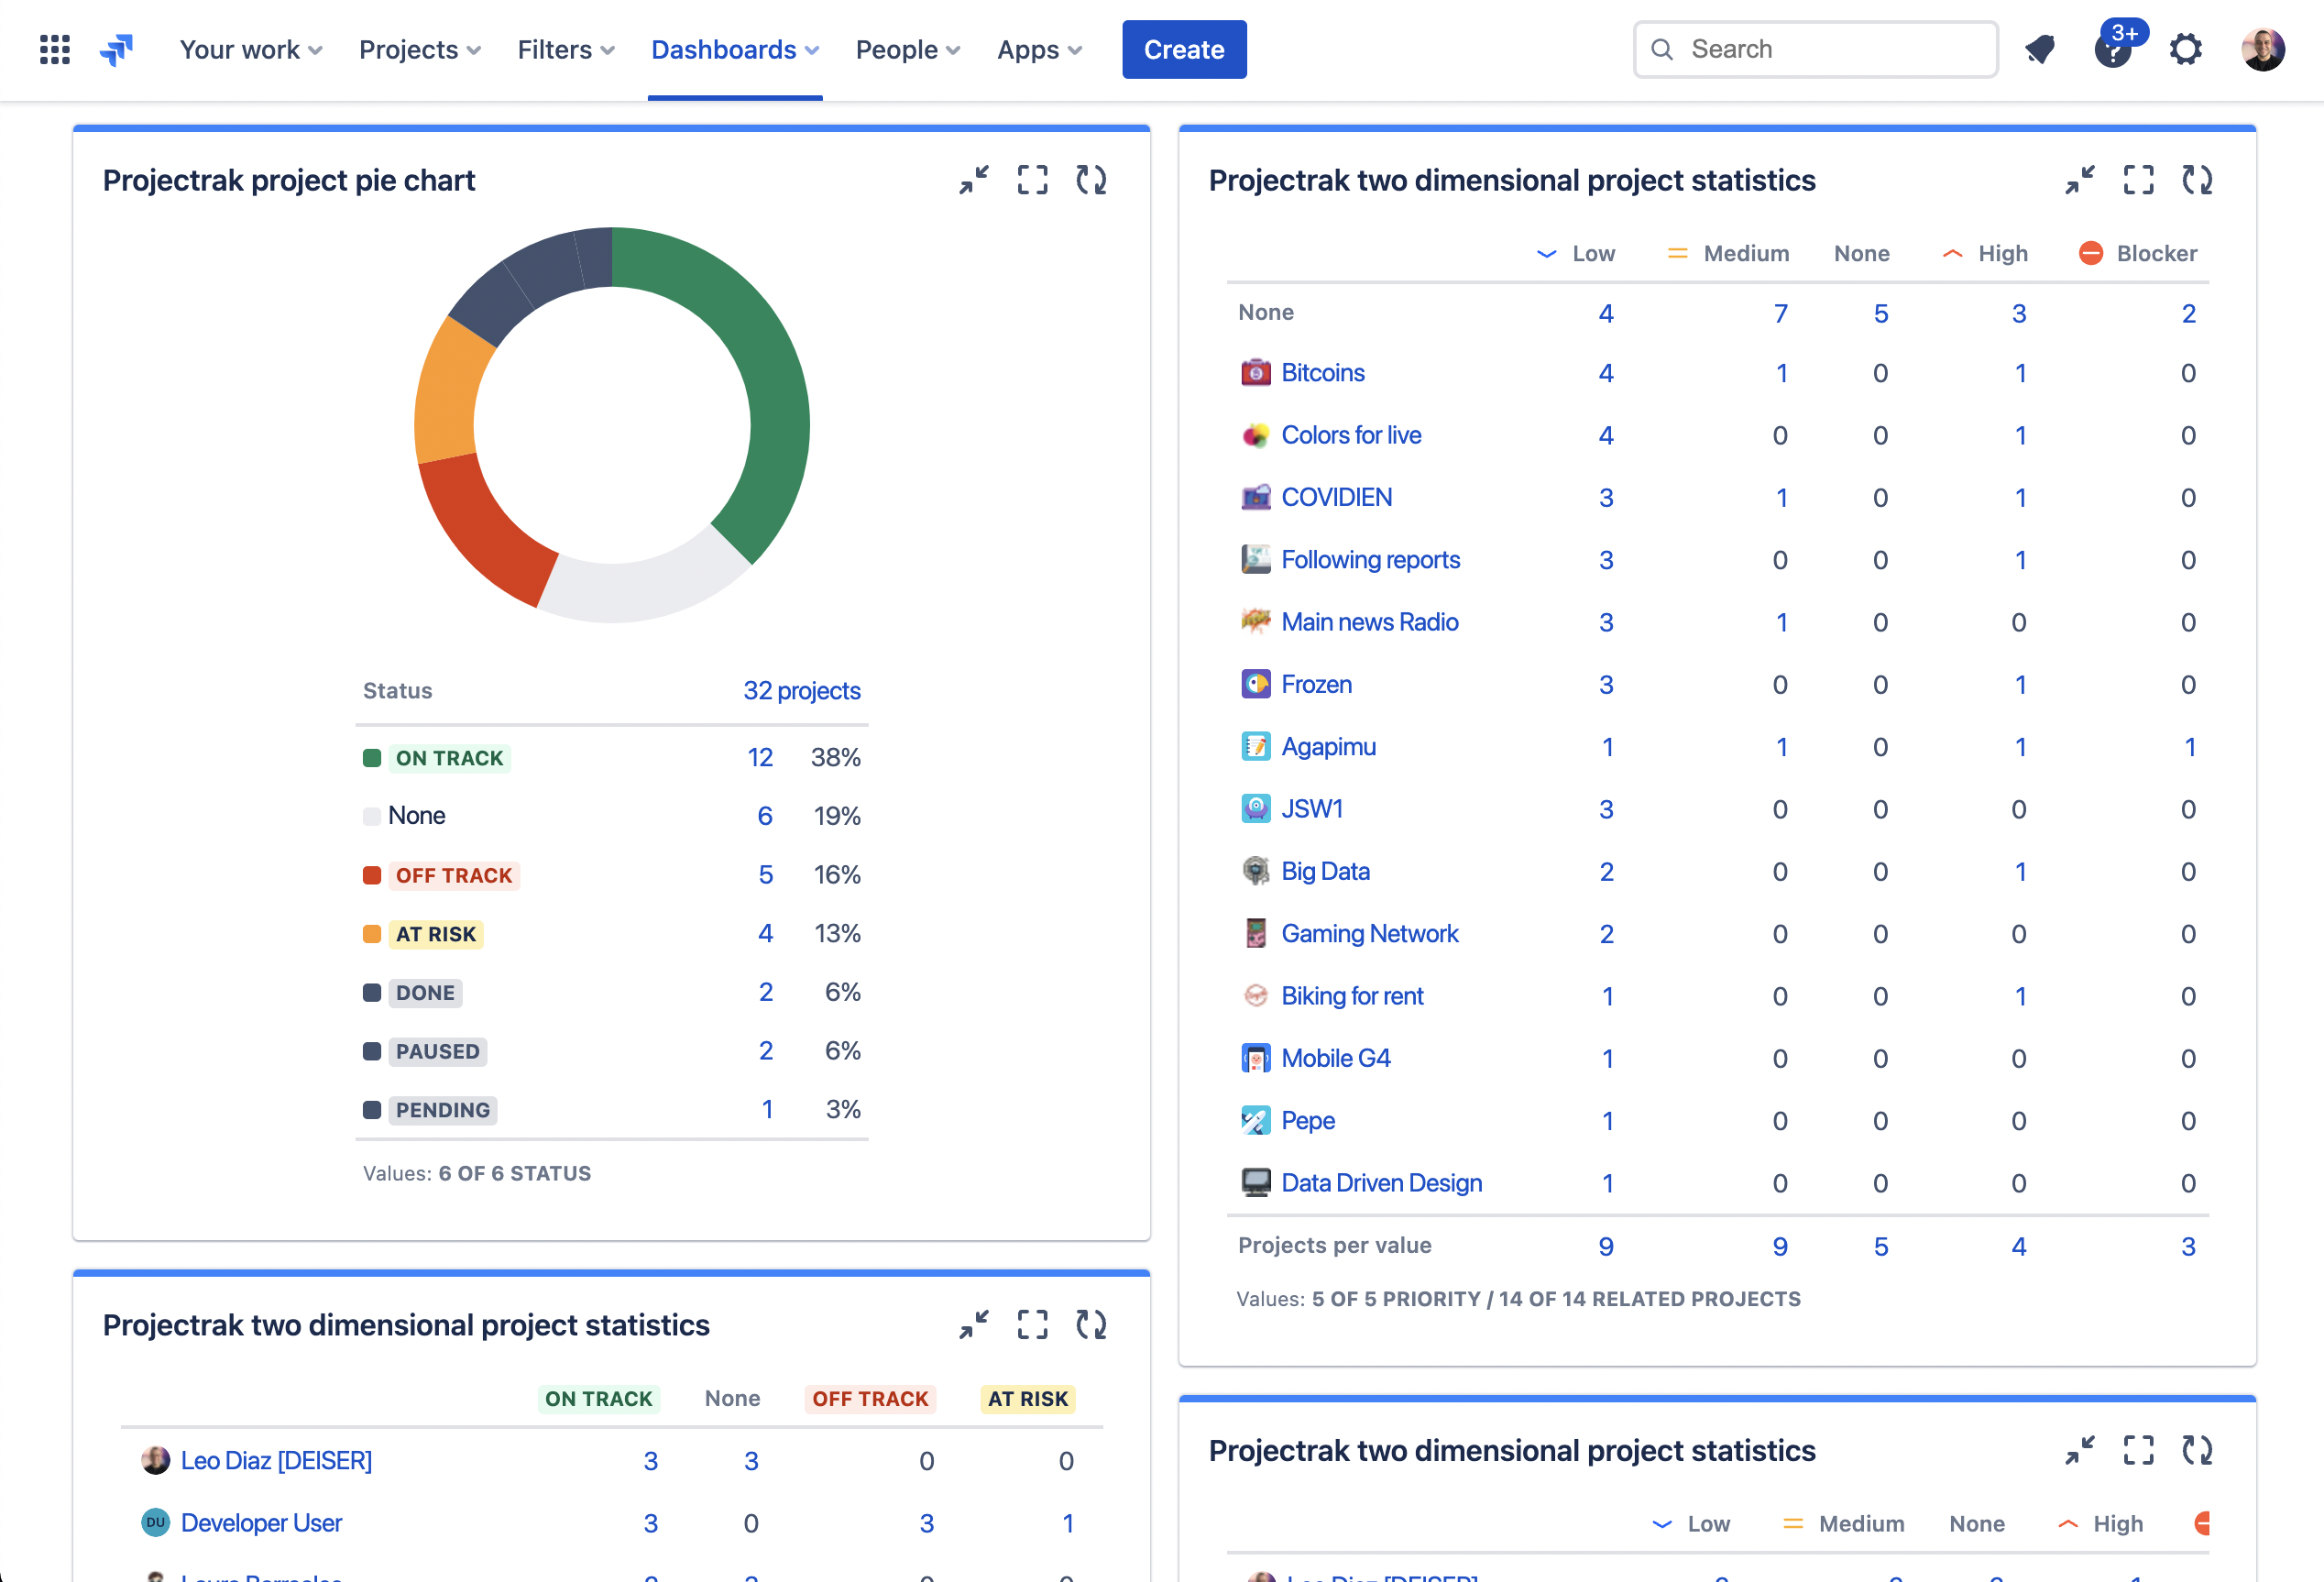
Once the gadget is configured, you will see a graph, like the one shown at the beginning, in which the circle is divided into portions according to the number of projects, by value. You can also see a table with the number of projects and their percentage according to the value of each one. It is also possible to see the total number of projects according to the query (PQL) and from each value, you can access the results, in detail, in the Project Navigator. It is now possible to analyze the project report and draw appropriate conclusions!
The following, are a few use cases and benefits they could offer. Projectrak users need reports, and Jira's gadgets and those offered by Projectrak, are an easy way to analyze the status of your projects.


No Comments Yet
Let us know what you think