Menu

EN | ES

How to export project data from Jira Cloud to Microsoft Power BI

DOIT-BI
Jun 16, 2021 4:29:00 PM

Sometimes, for a wide range of different reasons, a company works with different types of software, and despite Jira itself has different solutions to create reports and charts, Microsoft Power BI is another well used. This time, we will show you how easy it's to export project data from Jira Cloud and bring it into Power BI by following just a few simple steps.

Microsoft Power BI is a tool that helps different teams to make the right business decisions based on attractive charts, as well it's true Jira has a similar offer: for some teams, it might not be enough; that's why we are going to show how to get data from Jira to Power BI, using the Microsoft Power BI Connector for Jira Cloud app made by DOIT-BI, allows exporting project data from Jira, such as Projectrack project custom fields, into Microsoft Power BI, let's see why this is a solution might be attractive for you:

Why structuring project data from Projectrak to Power BI?

There're as many reasons as you might have when creating reports, maybe in your company is needed to make more visible the work in Jira, and the executives use Power BI; maybe you need to show weekly reports to the managers through the Microsoft tool, whatever the case is, here we show you four reasons why:

  1. The Projectrak & Microsoft Power BI Connector for Jira Cloud integration lets you build informative visualizations in Power BI.

  2. Use Projectrak's Jira project data to create reports in Power BI at the project level and across projects.

  3. Save time! Using Microsoft Power BI Connector for Jira Cloud, the information you get from Projectrak will be immediately ready to build reports. You will not need to make additional changes.

  4. It's possible to use the PQL filters built into the Microsoft Power BI Connector for the Jira app if you need data about certain projects.

We will show you how to export project data from Jira Cloud to Power BI in the following example. You can bring all your costs, budget-related, time spent information and, overall project information from Jira Cloud and build amazing charts in Microsoft Power BI.

Preparing the project information in Jira with Projectrak

To build compelling reports in Power BI based on your Jira Cloud information, first, we need to organize and channel that information as projects within Jira using Projectrak. To this end, we will show you an example of how to configure the data in Projectrak:

How to configure project data in Projectrak?

As we are going to build a chart containing financial information about your projects in Jira, we need to create the following custom fields:

  1. A Number type of field named "Project Budget."
  2. Another Number type of field named "Estimated Project Cost." 
  3. An "Original estimate" type of field made with the formula to calculate the "Original estimate" of all project issues.
  4. A "Remaining Estimate" field made with a formula to calculate the "Remaining estimate" of all project issues.
  5. A "Time Spent" field made with a formula that calculates the "Time Spent" within all the project issues.
  6. And a Multi-select field type named "Technology," there we will itemize the different types of technologies used in the project.

Get all the formulas on this article, part of the "Project Timesheet Report".

Projectrak for Jira layout to standariza Jira Cloud project information

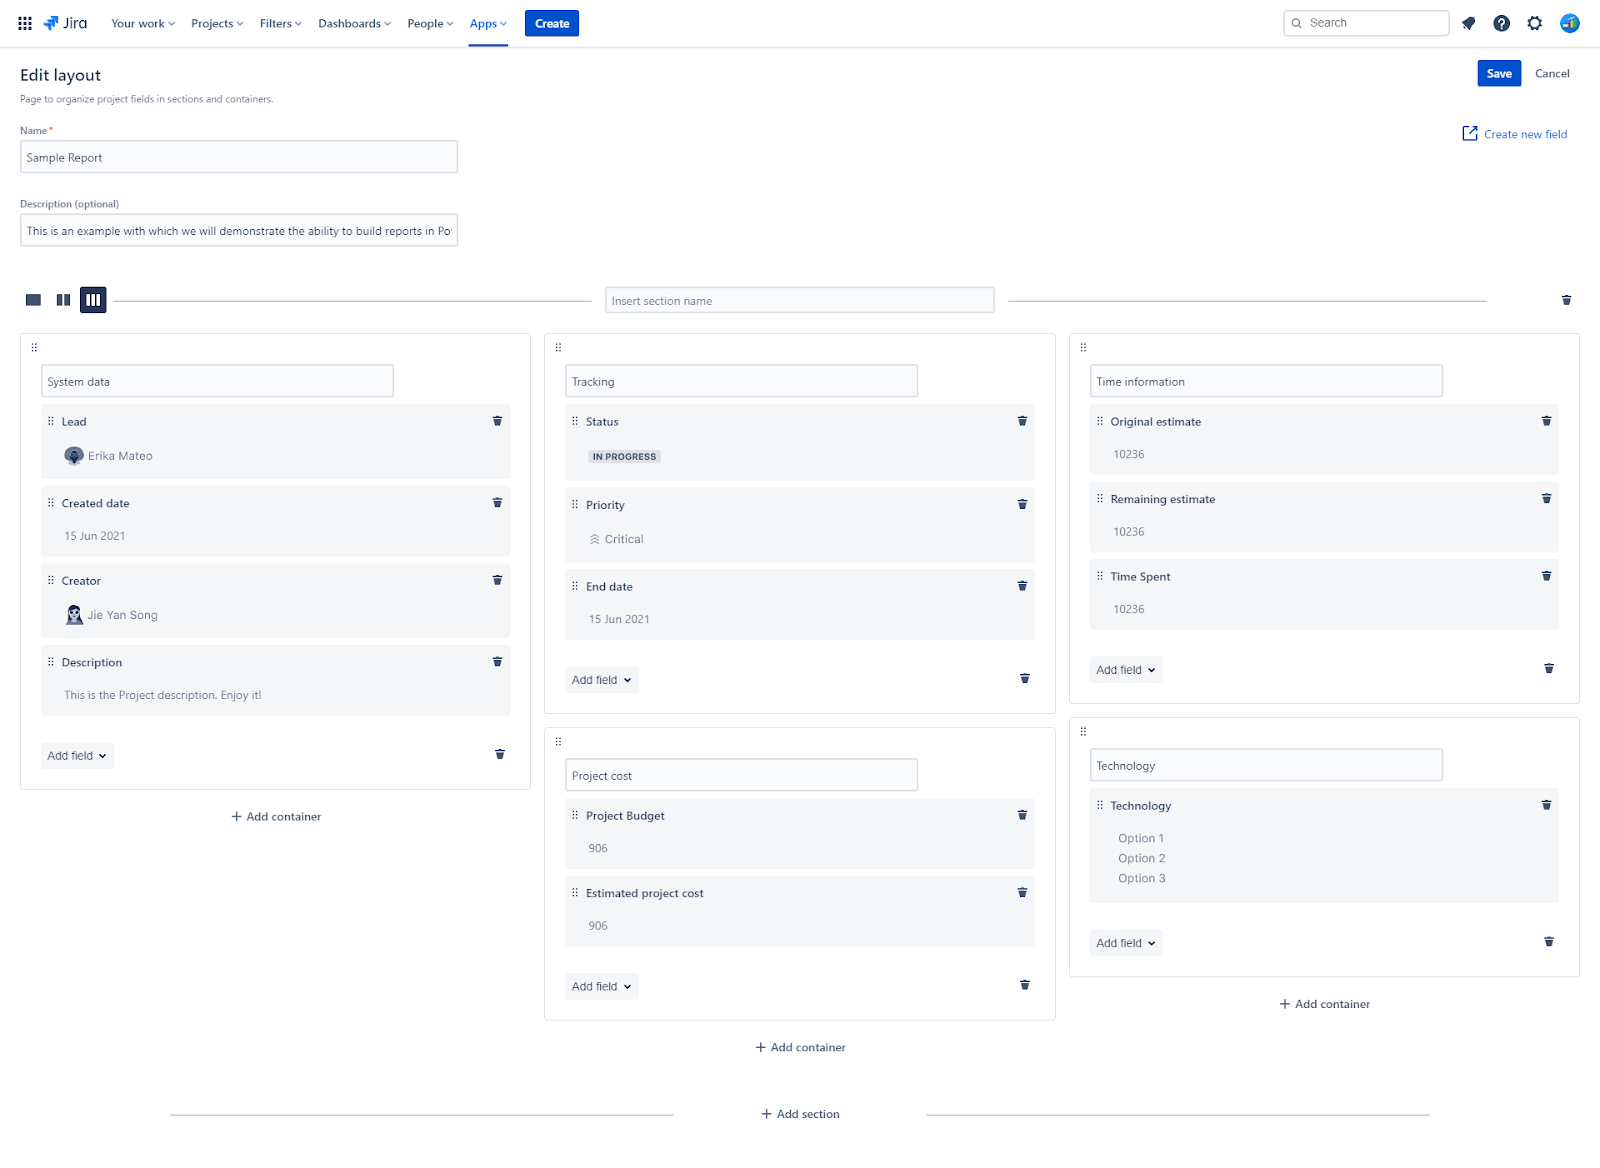
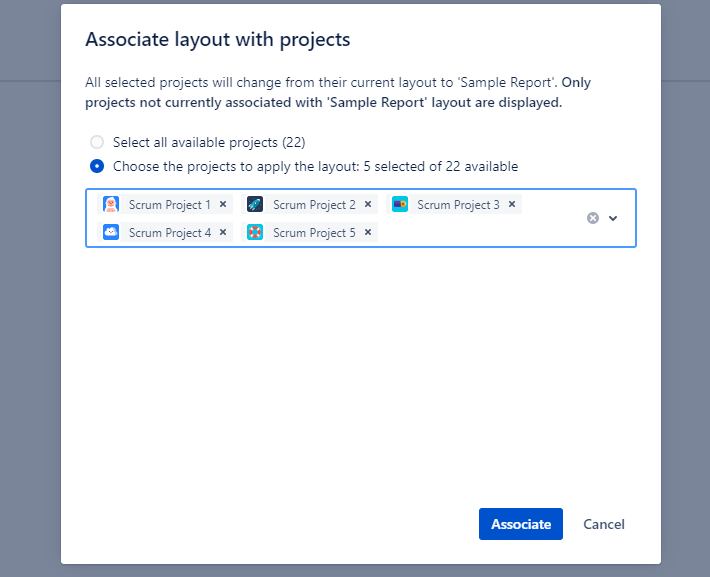
As seen above, we need to create a Layout we will name "Sample Report," then let's associate the previous fields listed before, as we see below:

associate jira project custom fields to a projectrak layout to standarize project data

Learn which projects fields are recommended to track projects in Jira Cloud effectively >>

Preparing Microsoft Power BI Connector to connect it with Projectrak 

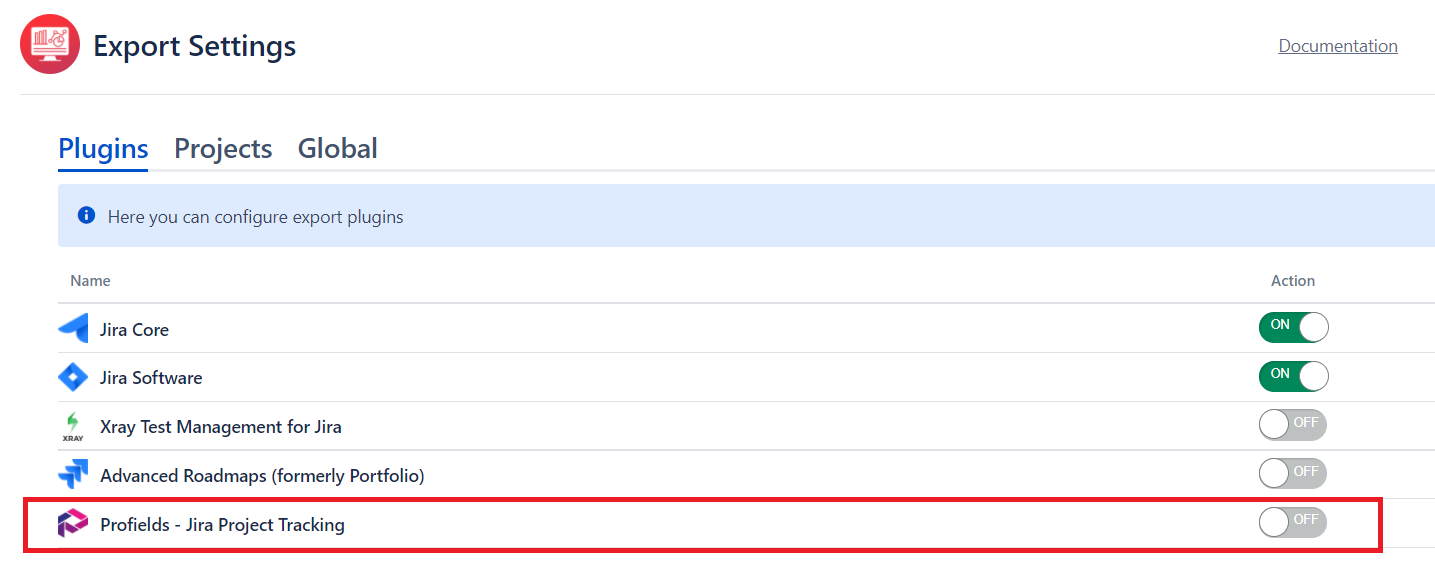
Once Projectrak's set, it's the moment to configure Microsoft Power BI Connector, to bring Jira project data to Power BI, it will only take a couple of steps:

  1. Activate Projectrack from the Microsoft Power BI Connector's Global Export Settings as shown in the following image. Be sure the export permission switches on when it turns from grey to green:
    Activate Projectrack from the Microsoft Power BI Connectors Global Export Settings
  2. Right after, a pop-up window will show the instructions to activate Projectrak.
  3. To wrap it up, it will only be necessary to generate an API Key ID and an API Key.
    how to activate Projectrak into Microsoft Power BI Connector for Jira cloud

  4. Press the confirm button to be sure it will successfully connect both apps.

Check Projectrak's documentation for further details about the integration >>

Using project data from Projectrak into Microsoft Power BI

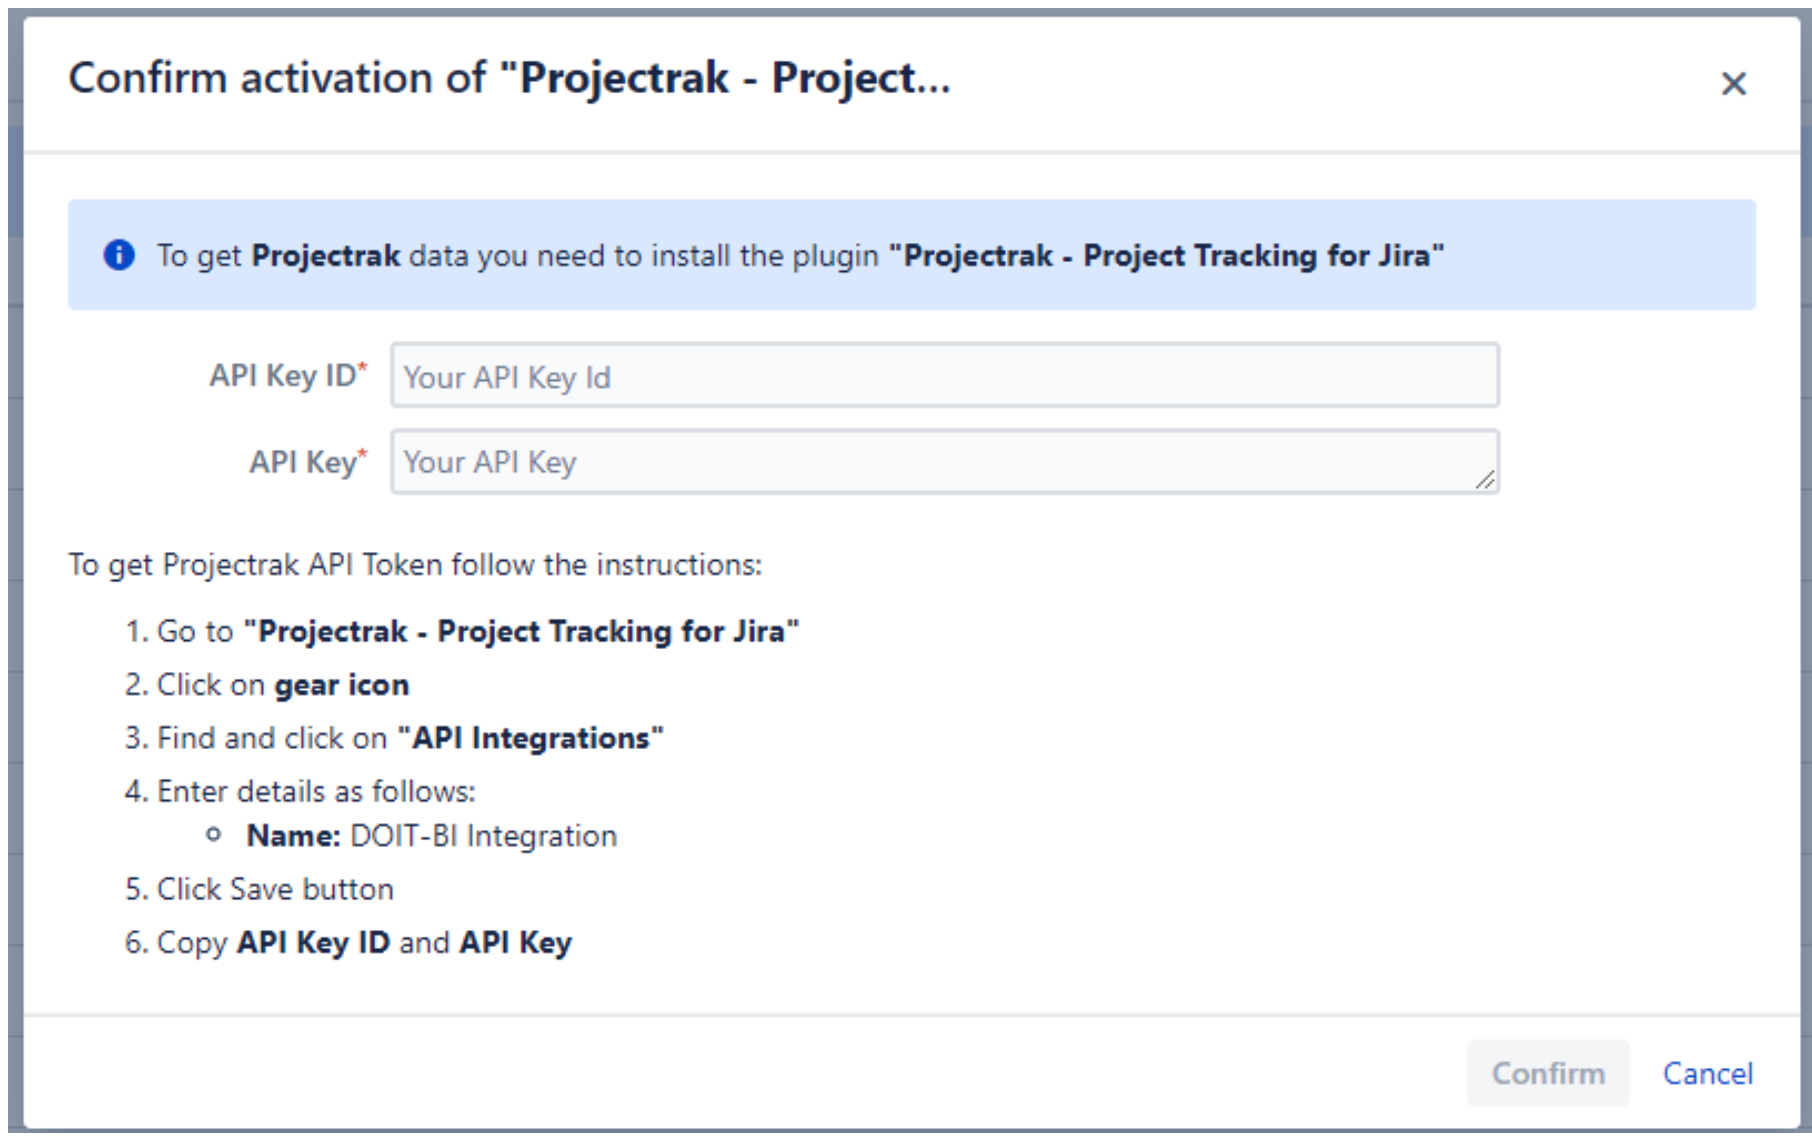
After activating Projectrak export permissions within the Power BI Connector for Jira Cloud, the app item will be available in the left menu, corresponding to Projectrak; get in there to create the connector, and check the project fields we want to export to Microsoft Power BI.

For this example, we will use the following fields (Do you remember the ones we have created before within Projectrak?):

  •    From the Projects table, in the Jira Core tab: Key and Name. 
  •    From the Projectrak table, in the Projectrak tab: Status, Priority, Project Budget, Estimated Project Cost, Technology, Remaining Estimate, Time Spent, and Original Estimate.

Once this is set, it's time to create the reports in Power BI. This time, we will show you which elements we use to display the project information from Jira Cloud.

Project Report 1: Project Cost by Status

Project Report 1 Project Cost by Status - Projectrak - and - power bi connector for jira cloud - deiser
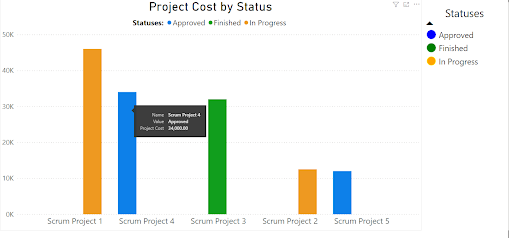
For this report, we used two visualizations:

  •    We are using a "Clustered Column" chart type to represent the information as a bar chart.
  •    and a Table to describe the different project statuses.

Project Report 2: Project Priority by Status

Project Report 2 - Project Priority By Status - with Projectrak Cloud and Power BI connector for Jira Cloud - DEISER

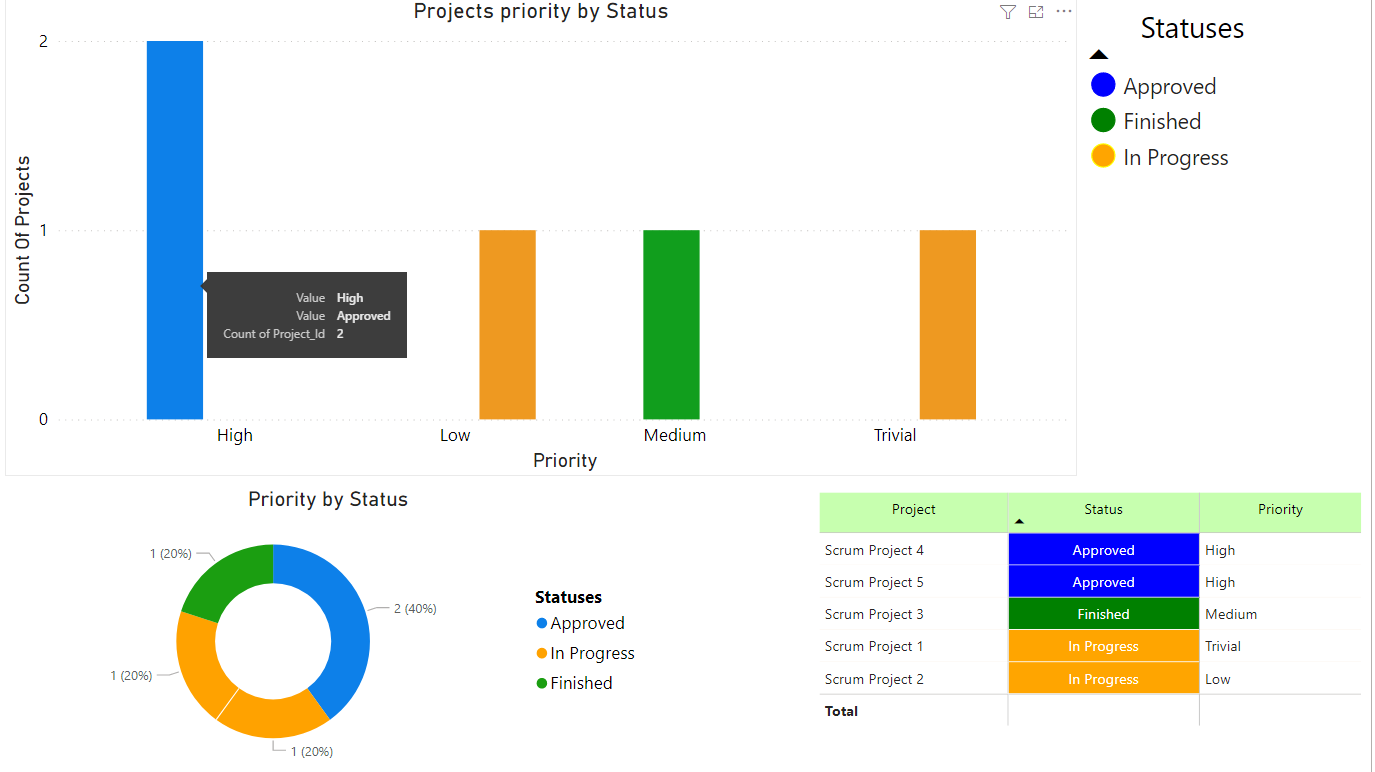
Here we use the following visualizations:

  •    The Clustered Column Chart represents a bar type chart.
  •    The Table describes the different project statuses and priorities.
  •    The Donut Chart type to show the Priority by Status.

Project Report 3: Project Timesheet Report

Project Report 3 - Project Timesheet Report with Projecterak and Power BI connector for Jira Cloud - DEISER
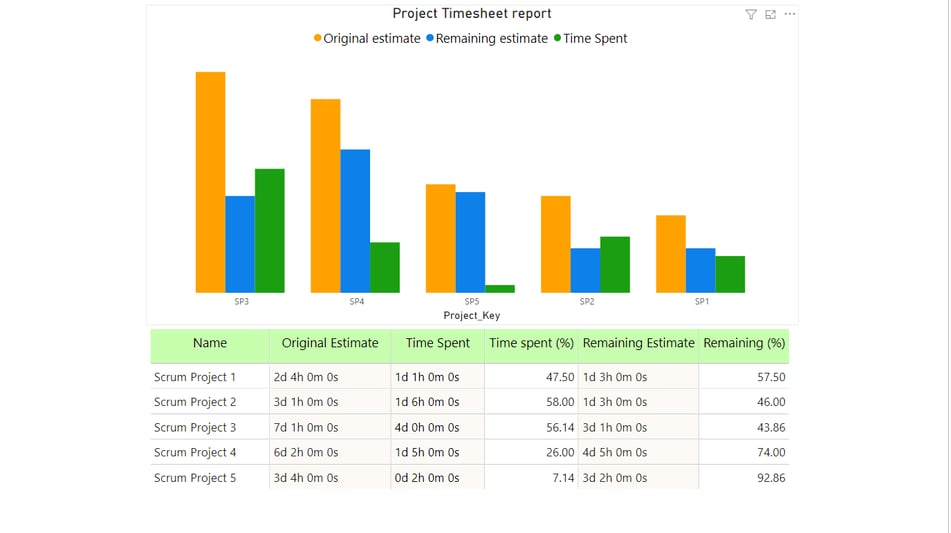
For this report, we have used the following visualizations:

  •    A Clustered Column chart type to represent a bar chart.
  •    A Table to describe the time tracking of interest.

These are just examples that show what can be done by integrating Projectrak and Microsoft Power BI Connector for Jira Cloud, which represents a feasible solution to get your project data from Jira to create informative reports in Power BI.

Do you need to have these types of reports in Jira? Check how to get them >> 

With Microsoft Power BI Connector for Jira Cloud, it's possible to structure project information from Projectrak, translating it into a wide range of attractive project reports in Microsoft Power BI. Both solutions are available on the Atlassian Marketplace.

This blog is a collaboration with Ofelia from the DOIT-BI team and the DEISER team.

Mockup_ebook_7_uses_of_Projectrak_and_Automation_for_Jira

Learn more about Jira project automation 

Download the ultimate e-book containing seven use cases when automating tasks in Jira that respond to project actions in a series of different situations.

By implementing the solution shown in the E-book, you will be able to leave to the tool all those time-consuming tasks related to your projects.

DOWNLOAD NOW

You May Also Like

These Stories on Jira Software

No Comments Yet

Let us know what you think

Subscribe by Email