

Among the benefits of using Jira for project management to enhance your Jira project reporting you just need two basic ingredients: Projectrak, which offers a data platform to store, organize, and visualize project information in Jira; and eazyBI, a powerful business intelligence engine. Both, are integrated natively and available at the Atlassian Marketplace.
Follow these tips to start using them, and reap the benefits of simple, automated project intelligence and Jira data visualization. But first, let's address the main concern and the following steps:
Jira project reporting benefits are key when it comes to refining your project management business intelligence. When everyone has the power to know every detail about their projects, from the Jira budget management or the time spent in a project, on different projects, teams work more efficiently towards a common goal: to grow as a business.
Integrating systems can be complex: human interactions, work alignment, business goals aligned, and many more factors...
It wasn't the case for Jira reporting plugins such as Projectrak and eazyBI which have merged for the common good; in this video, eazyBI's CEO Raimonds Simanovskis explains how this integration came to life:
As Raimonds mentions, the integration was quickly decided because both apps have the same focus: to provide the best insights and data about the teamwork of technicians and managers using Jira. Before getting into what matters regarding this integration, let's answer some important questions:
How does Projectrak enhance Jira project reporting?
That's simple, Projectrak enhances Jira project reporting by providing structured project-level data for advanced Jira project analysis, custom KPIs, and portfolio insights. It enables real-time, automated reports, helping teams track progress, forecast risks, and optimize resources. With customizable dashboards and powerful visualizations, Projectrak ensures data-driven decisions and improved project portfolio management in Jira.
Knowing that, let's get into it with seven tips about this integration and how to improve project reporting in Jira.
Get more information about Jira projects with fields such as due dates, status, or budgets; also it allows you to see which one is open and add another kind of information you may need:

Don't accept imitations. It's the best way to obtain all the data of your projects in Jira to create visualizations simply.
eazyBI, as one of the best-sell reporting apps in the Atlassian Marketplace, allows to get perfectly well-structured dashboards in Jira, through robust project calculations supported by Projectrak, and it can be shown through a wide range of different charts.
By integrating this app with Projectrak, you'll get those details for projects. Imagine how those reports will look!
You don't need anything to integrate both tools! It's enough to have installed Projectrak and eazyBI in the same Jira instance. The rest will be a simple setup with no code.
See the video below for more information about Projectrak:
You may have tons of data. Make sure you only bring to eazyBI what you're going to be using for your visualizations! You'll be editing a simple interface like this one:
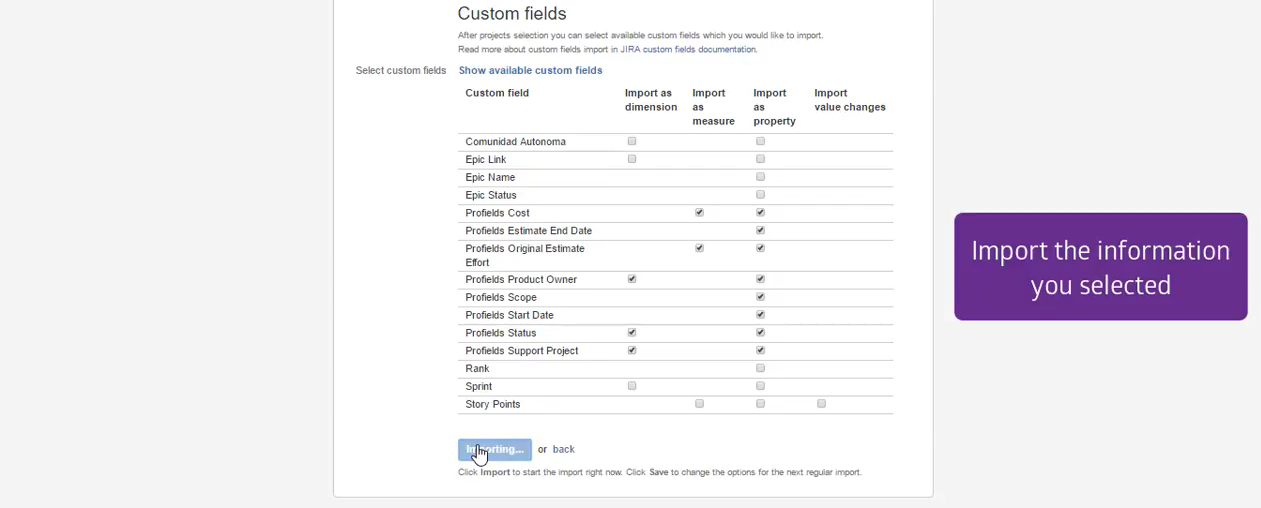
During the setup of your reports in eazyBI, you will be able to analyze and combine data that comes from Jira and Projectrak.
Be always mindful about how you combine them in your analysis. As a general rule, consider the two following approaches:
Yep, life is great, now is possible to set up the type of chart that better suits the information needed to see, analyze, and make better business decisions. Discover more more examples of charts showing Jira data visualization, and the best practices to set it up.
Final thoughts: Taking your Jira project reporting to the next level
By integrating Projectrak with eazyBI you'll get great benefits of Jira. You will transform the software too into a powerful project management reporting hub, giving teams real-time insights, custom analytics, and portfolio-level visibility, maximizing productivity within Jira. By structuring project data effectively, teams can track progress, optimize resources, and forecast risks with confidence. Whether you're a project manager, Jira admin, or executive, this integration empowers you to make data-driven decisions that drive efficiency and success.
If you have doubts, don't be shy! Contact us, or keep learning by subscribing to the Jira Project Reporting Academy, below:


No Comments Yet
Let us know what you think