
Project reports in Jira are key when it comes to communicating the status of projects to third party team stakeholders, the advantage of using Jira is the integration between eazyBI, an app that allows to create and customize reports, charts, and dashboard gadgets, and Projectrak (formerly Profields), which allows to centralizing all your project intelligence in Jira, organized by custom fields. Imagine the possibilities...
Project reports gain more value by integrating these two from the Atlassian Marketplace. Visualize, share, organize and centralize project information in Projectrak, into better graphics with the charts and drag-and-drop reporting interface provided by eazyBI. See this video as a quick example of what you can get to do!
In this article we'll be going through a step-by-step on how to connect the integration between Projectrak and eazyBI, so you can leverage for your advantage:
First of all, you need to get the free 30 days trial of Projectrak for Jira in the Atlassian Marketplace. Once you have it, it's time to create a Layout in Projectrak for Jira, on a screen similar to the one below.
If you are looking for more detailed information on this step, please check this page of our documentation center.
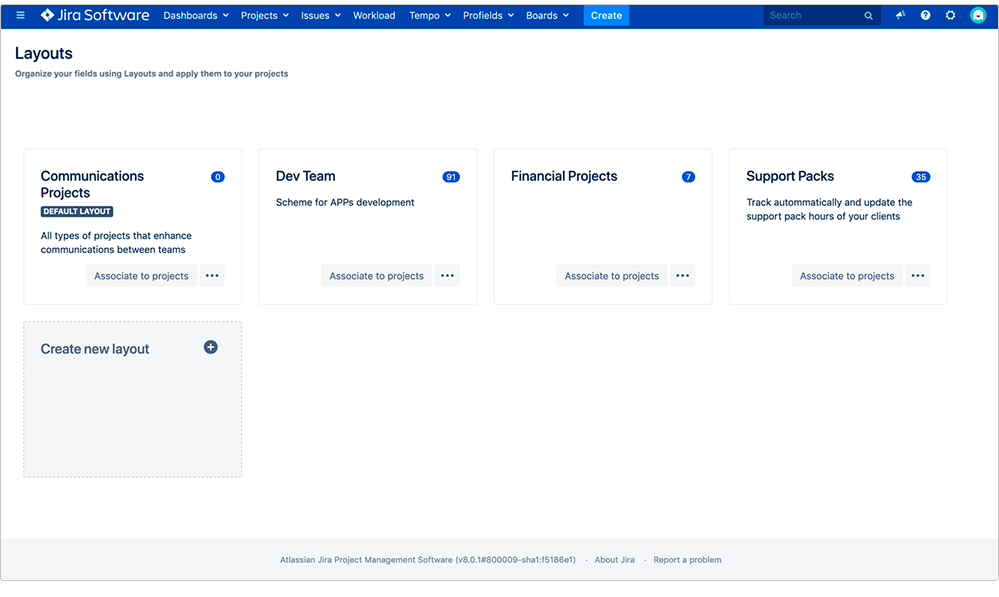
After creating the layout, comes an exciting moment, it's time to create the project custom fields the Jira project needs. Be sure to have everything planned before uploading the information to the software:
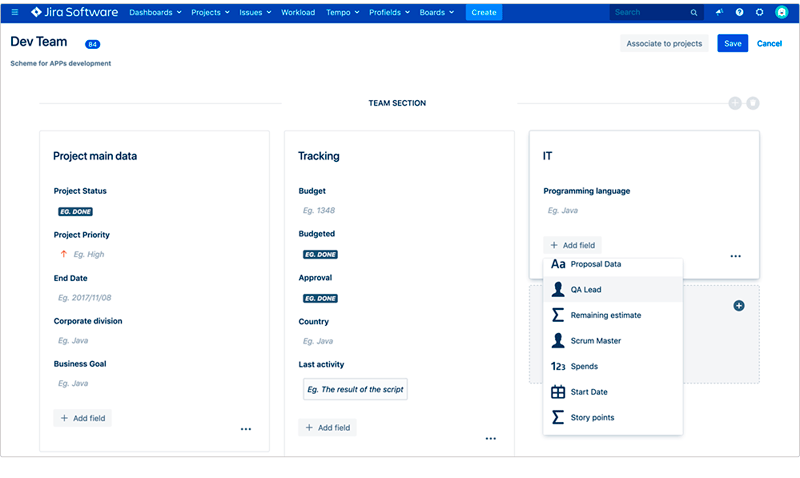
Now, the layouts created at the beginning, has to be linked to the projects in Jira.
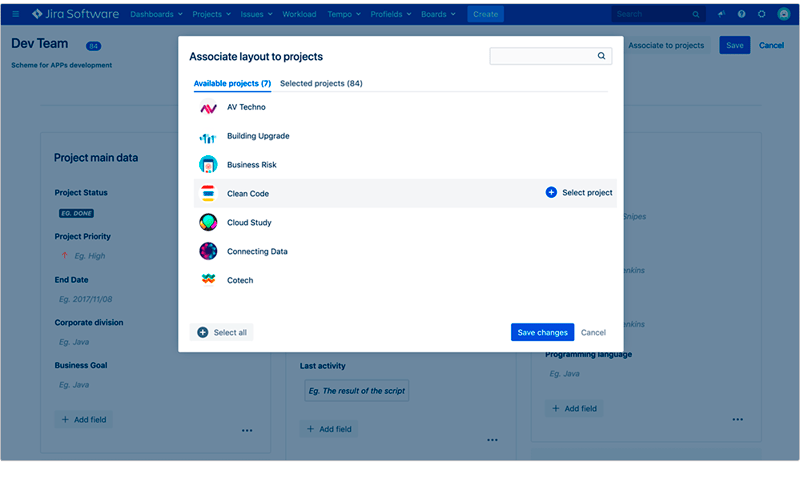
This is crucial, give the needed values to your Projectrak Project Navigator columns before start using it, another way it could be a mess after. More information available at our documentation center.
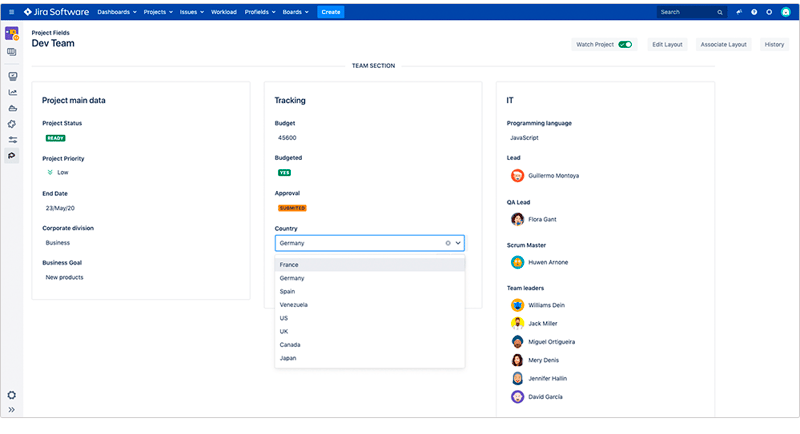
Congratulations, now Projectrak app for Jira is set up, and full with all project organized information from Jira issues. Now it's the moment to integrate it with Projectrak.
Of course, it is important to have an eazyBI trial or a full license available in the Atlassian Marketplace.
Import all the information you need by clicking into the Settings field in eazyBI. There you will see new fields from Jira projects coming from Projectrak. 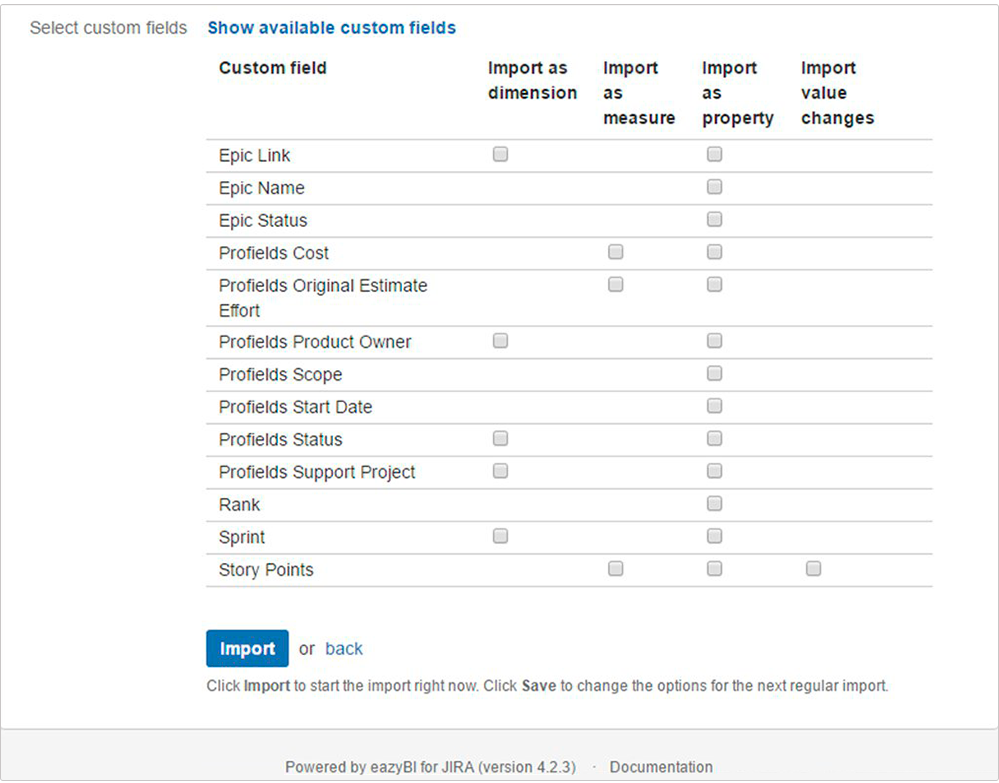
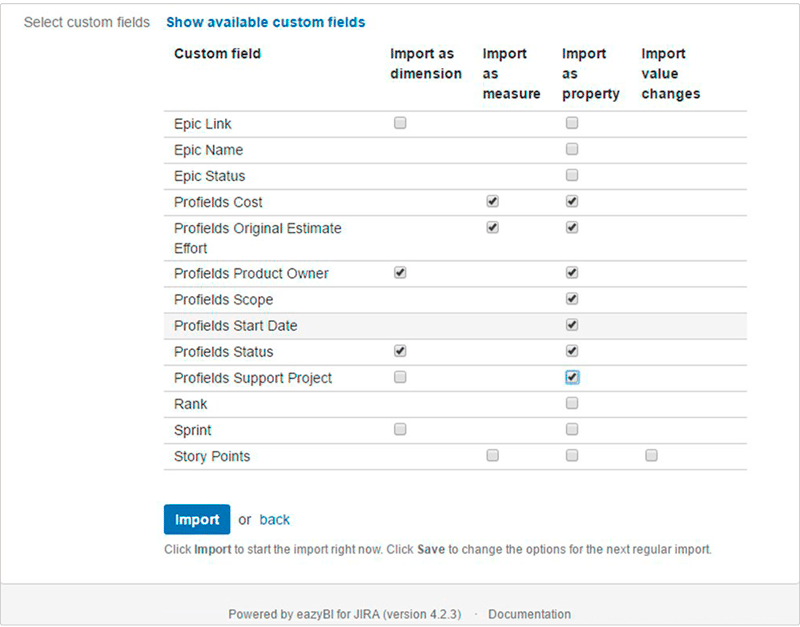
Select the details you want to Import, depending on the range you want to measure in the datacube (Dimension, Measure or Property). This will depend on our needs and the field you want to work with.
Finally, import the information you selected:
At this point, you're probably excited to start creating useful charts for your projects and start showing
how far you have taken those projects you are managing. Let's see how to use it!
Once you get into the Reports Editor in eazyBI, you will see a new Projectrak section with all the fields chosen: Lists, users, and others.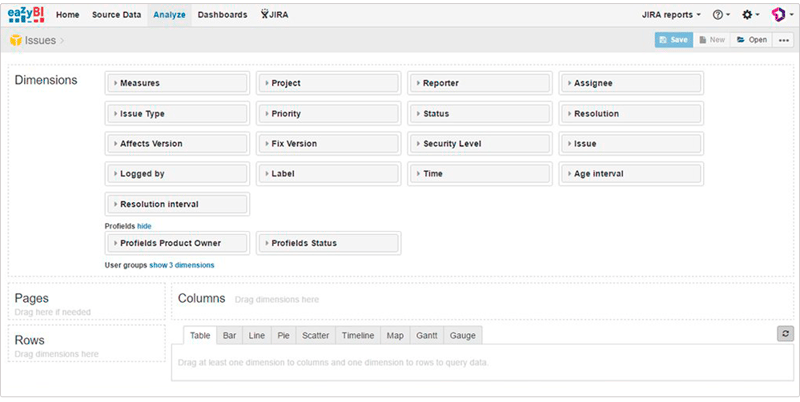
By selecting the "Measures" field, you'll see a Projectrak section with all this information calculated.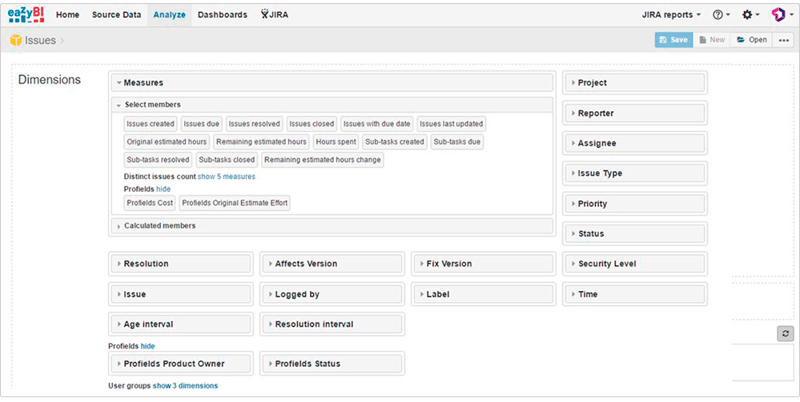
In the "Calculated Members" field, is available the Projectrak data as "Properties" into the datacube.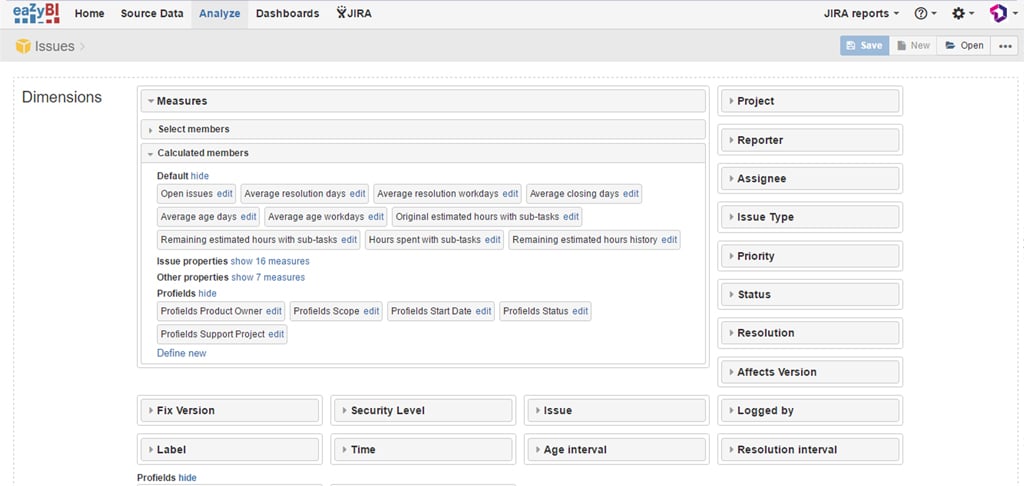
To generate reports only with Projectrak information, you will have to add the "Projects" field (Only if you want information about your projects), and then select "Measures" with the desired fields marked.
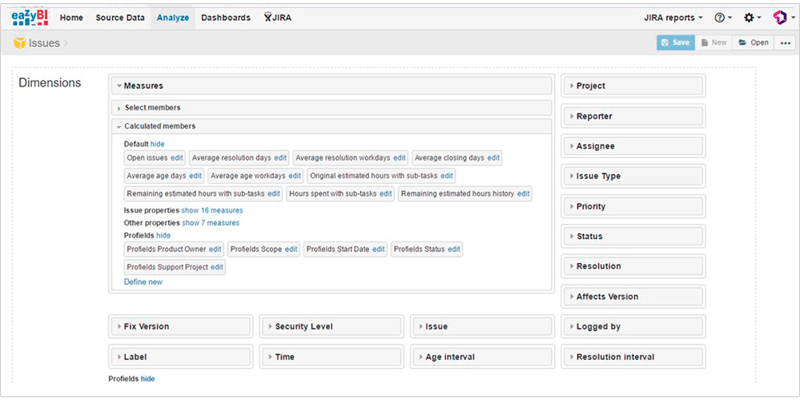
It's time to start reporting about Jira projects with great information and excellent graphics; it's simple!
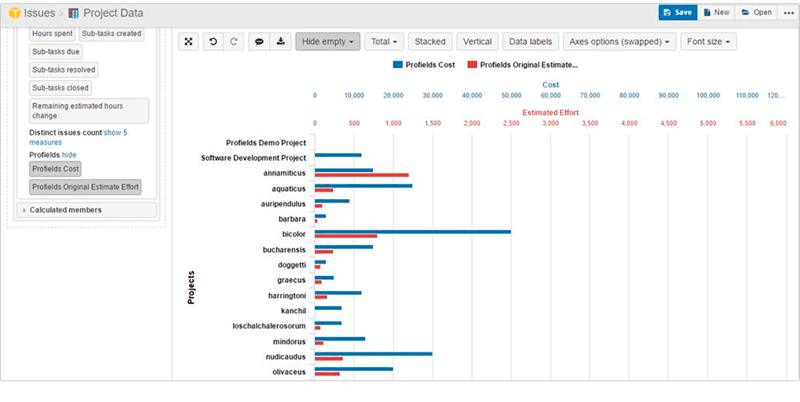
Once the integration between eazyBI and Projectrak is running, it's also important to know which results are able to achieve and which kind of colorful charts can be made. That's why here we present some examples of what can be achieved.
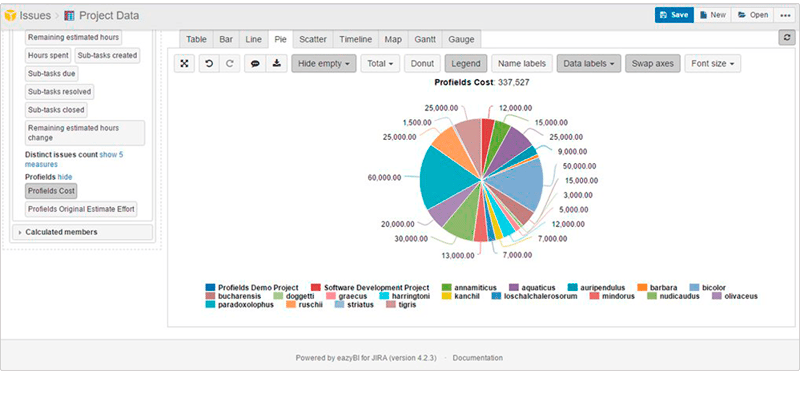
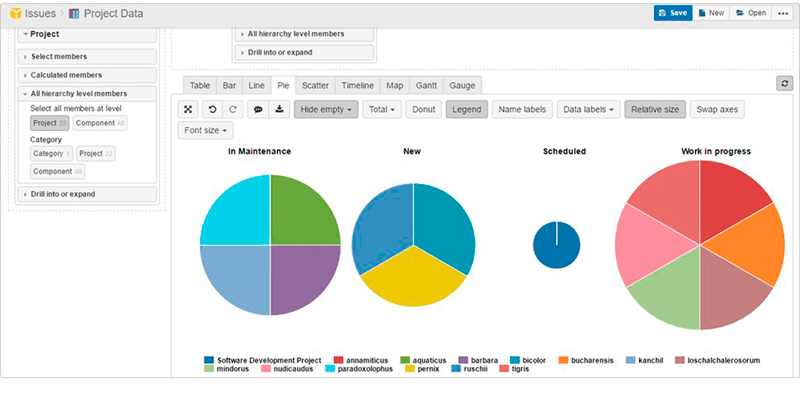
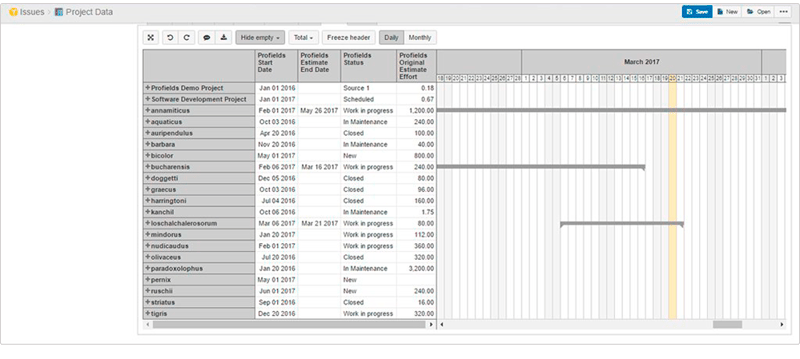
And this is only examples of the powerful project reporting opportunities can be granted by integrating these two apps. Transform Jira into a graphic-reporting interface with of eazyBI and Projectrak.
Find more answers on the instructional video below showing a walk-through the integration of these two apps available in the Atlassian Marketplace, or pass by the documentation center of Projectrak.
These Stories on Jira Software
No Comments Yet
Let us know what you think