

Data represents the starting point for taking actions that directly impact business and an entire organization. Data analysis is necessary for the growth of organizations. Consequently, we'll define the concepts related to this area and introduce the leading solutions that are helping companies worldwide make data-driven decisions introducing improvements in their organization.
The effectiveness of data-driven business decision-making depends on the people, followed by the infrastructure where the business strategy is built. Choosing both wisely is a crucial step. This union will allow you to analyze and describe the current situation, its progress and, depending on the organization's maturity, predict specific business scenarios. Let's go through the primary set of attributes that affects this process.
First, it's necessary to define what steps are likely to lead an organization to make decisions in a healthy, data-driven way:
A couple of points stand out in this list: a differentiation between data and information and the importance of software tool selection for practical business decision-making based on data.
Let's establish the importance of some of these points. Let's explain why:
Data and information are often referred to interchangeably; although they share certain similarities, they're slightly different terms in this context. The definitions offered by the Oxford English Dictionary are as follows:
To summarize, data refers to a specific representation of one or a set of attributes; these can be qualitative and quantitative and represent a variety of facts, while information is the set of processed data that communicates what it means. This transformation process is referred to as Business Intelligence (BI).
Therefore, we can state that the expected goal of data analysis is to transform data into information and communicate it in the best possible way. This goal is achieved through the creation of data visualization.
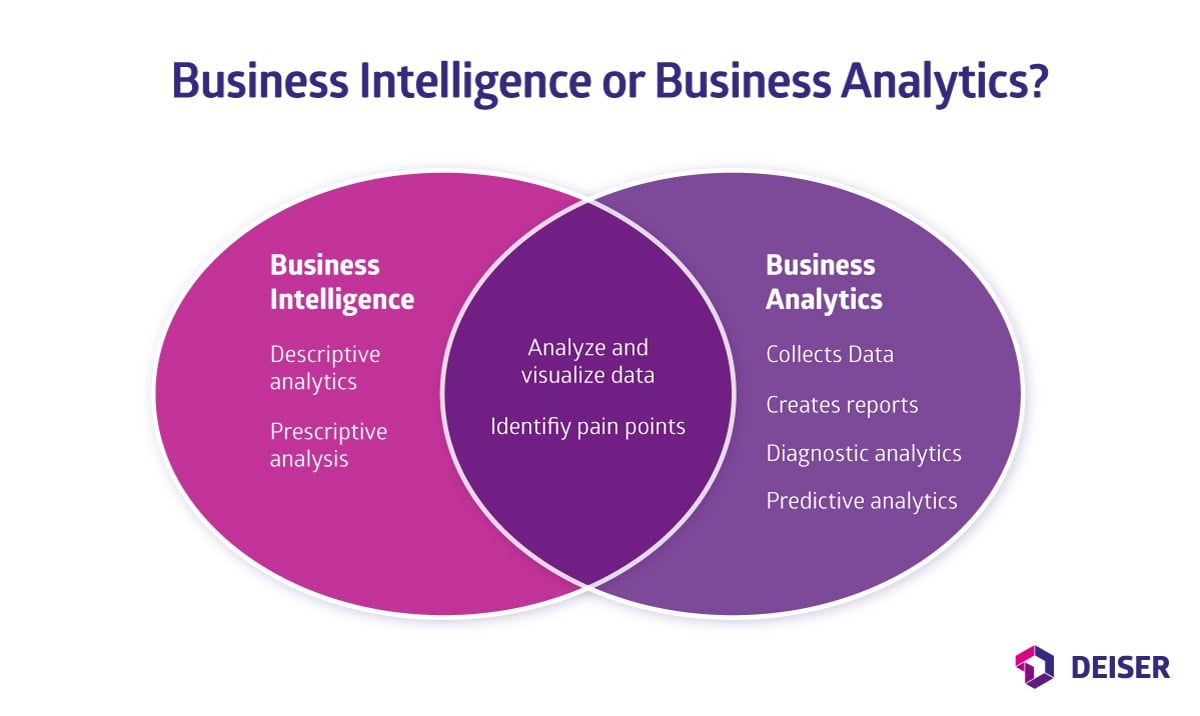
Apart from the data and information terms, business intelligence and Data Analytics concepts exist. What's the purpose of each of these disciplines, and at what point do they collide?
It's important to differentiate between both concepts in this context, as Business Intelligence is a consequence of the previous Analysis:
Using software tools to support BI and analysis processes centralizes data from all organization departments (sales, marketing, finance, people, etc.), establishing each area's performance and how it affects others, and vice versa.
There are many ways to achieve this successfully. The people who analyze and process the data and the decision-makers in the organization are responsible for this. And, of course, supported by the software tool of choice that centralizes the final information.
According to the annual Gartner® Magic Quadrant™ study corresponding to March 2022, there are currently two leading software tools on the market: Microsoft Power BI and Tableau (This same study named Jira Service Management, a visionary solution for IT Service Management in 2021.)
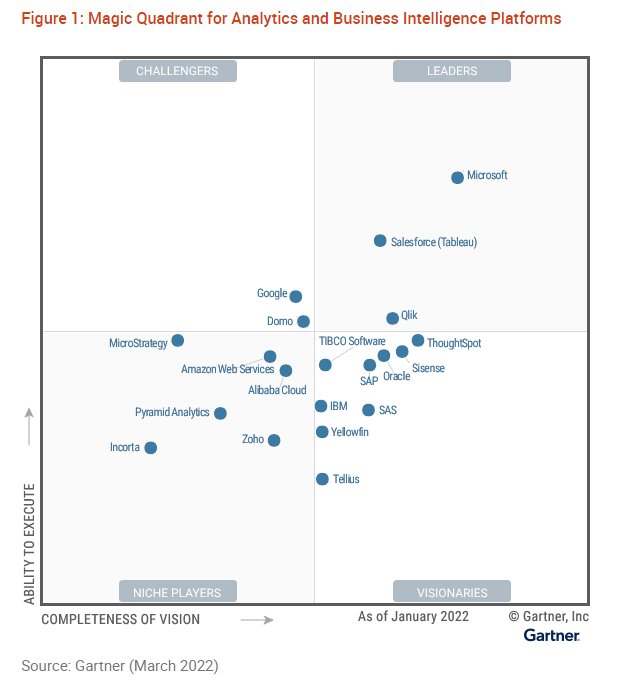 Gartner Magic Quadrant for Analytics and Business Intelligence platforms 2022
It's a software tool created by Microsoft that focuses on the cloud and helps manage high volumes and types of data and process it for analysis and visualization.
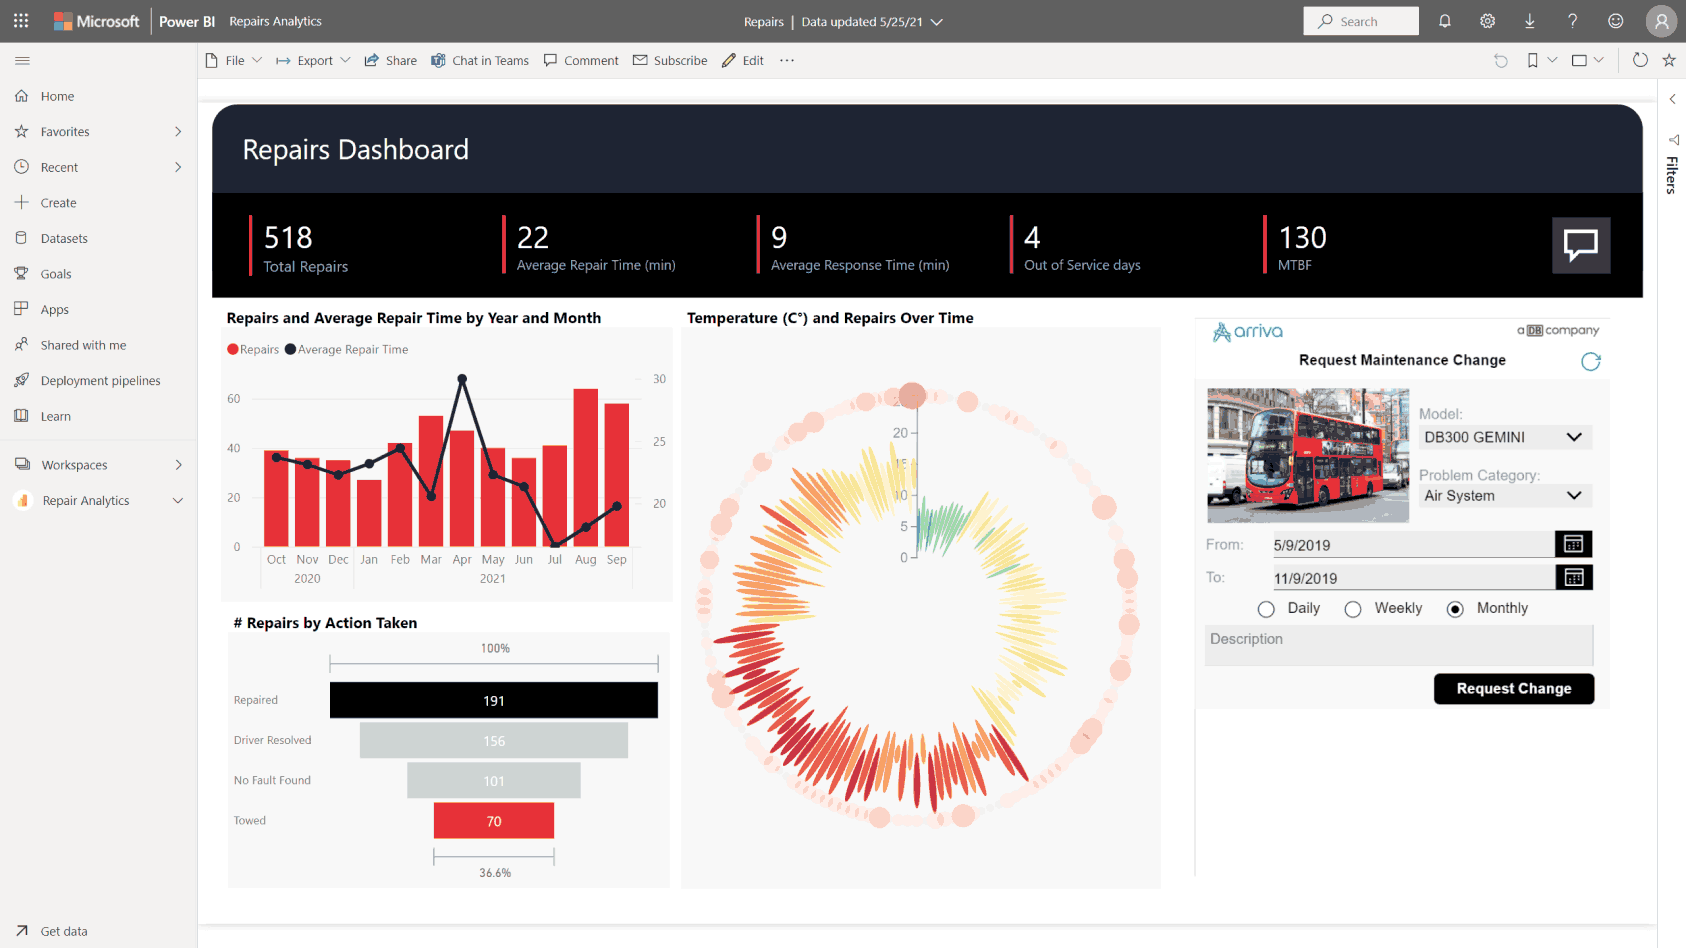
Power BI is currently the leading solution in the data analysis tools market; its simplicity in the data cleanup and formatting and the ease of getting data from third-party software tools through native integrations, connectors, APIs, and more, makes it one of the top solutions.
Feeding Power BI with data coming from the software tools where the work from other areas is managed facilitates the data analysis and BI. For example, suppose the Developers team has many projects in Jira. In that case, two apps will bring that information to Power BI, one to track these projects based on specific attributes - to get statistics such as the number of projects, dates, statuses, etc., and another app will extract this project data from Jira to Power BI (it's available for Cloud or Data Center) without further effort.
The Desktop option is recommended when getting started with Power BI. It's more basic than the cloud version (according to the Gartner report) and offers good possibilities from the start. For later stages, it's possible to upgrade to complete plans, depending on your needs.
In the following, we'll present the main advantages of working with Microsoft Power BI, a powerful tool for data visualization with a focus on Business Intelligence:
Tableau was born as a project founded in 2003. A group of computer scientists from Stanford University created this tool to help people within an organization to make decisions based on data relevant to their business through visual analysis features.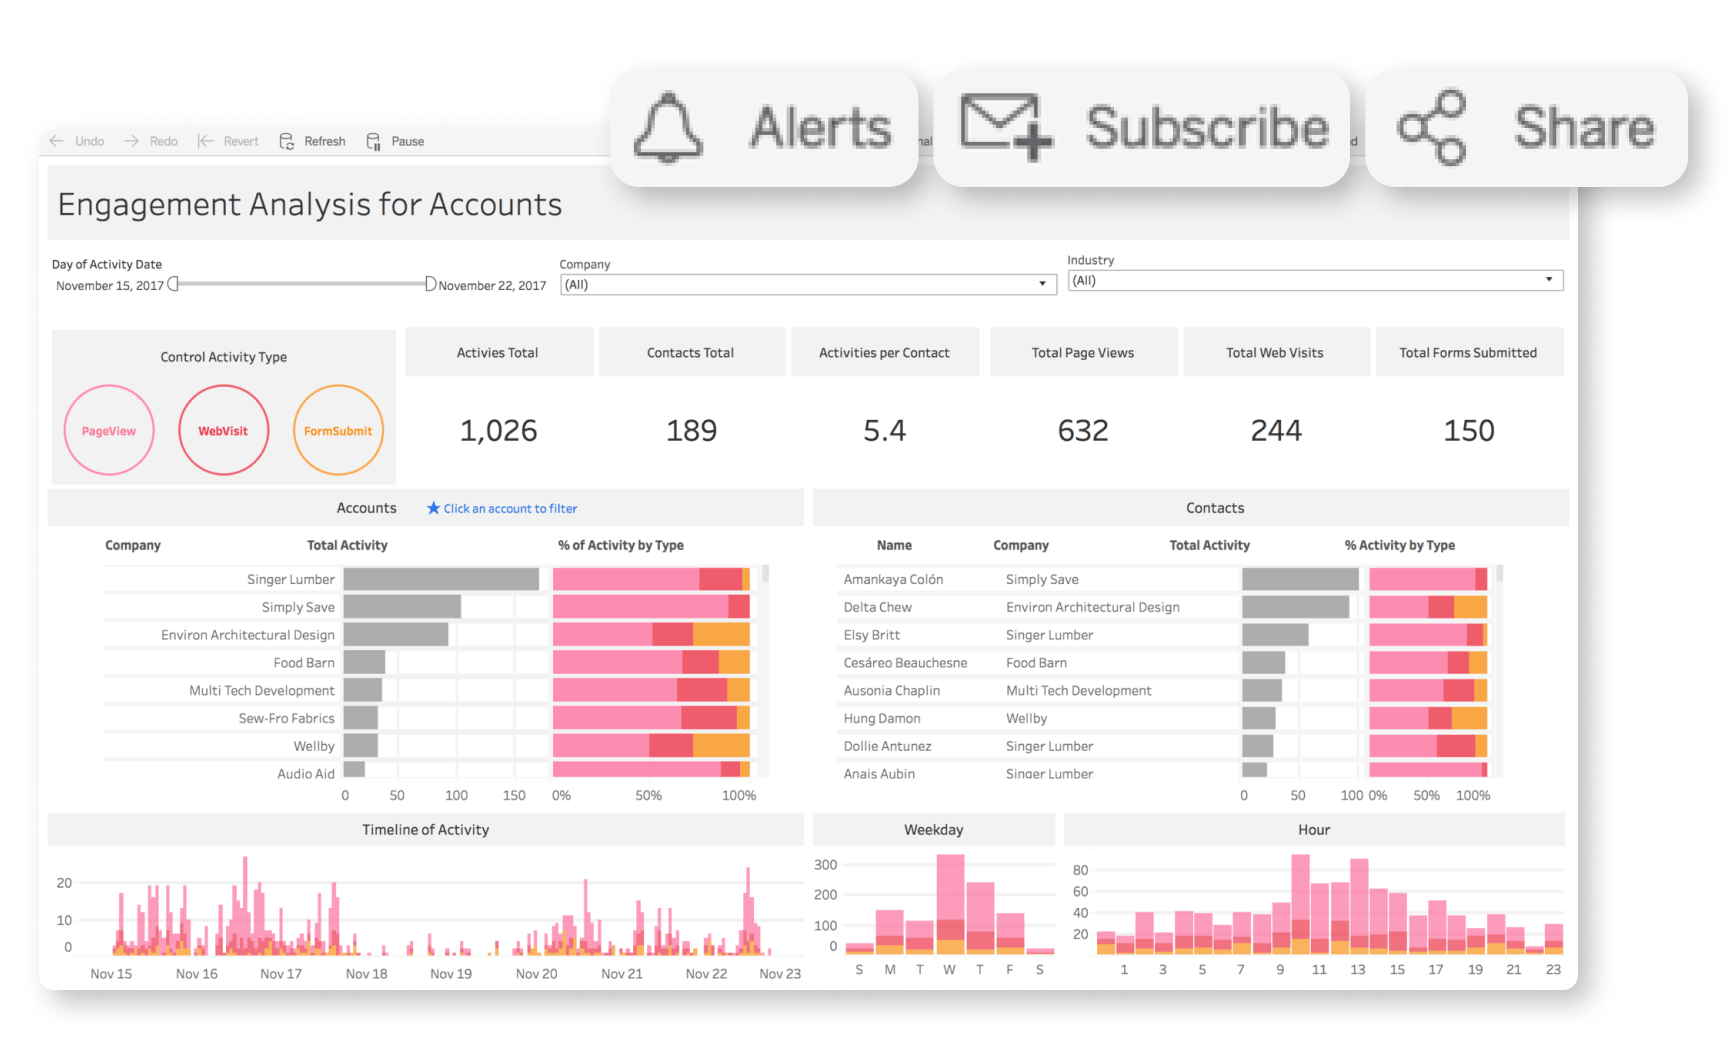
Followed by Power BI, Tableau is positioned second as a leader in the Gartner® Magic Quadrant™ for Business Intelligence and Analytics products.
In this study, Tableau stands out as an easy-to-use tool with its customization properties, and the possibility of native integration with Salesforce and other tools, such as Jira, using special connectors to obtain project information. A relevant feature for business teams when creating reports.
Tableau stands out as a leading option in the BI and Analytics platforms market because it facilitates the exploratory process and data management, streamlining the information visualization and sharing process. That's why we list below the main advantages of this tool:
Becoming a data-driven organization requires investments in data culture and technology to change how people make decisions. This includes fostering automatic and controlled learning from people and tools, statistics, natural language, and intelligent data preparation. Working consciously on each of these aspects will allow your organization to increase human creativity when performing analysis and optimizing different business areas within your organization. This makes an organization "data-driven," and only 8% of those organizations successfully achieve the goal nowadays.
The world of data is vast, and there are as many situations, processes, transactions, and other measurables coexisting. In this article, we've shown the leading tools and critical concepts you should know when undertaking an improvement in an organization's BI, enabling it by integrating it with other tools and sources of data for businesses.
If you need further guidance in extracting data from projects in Jira and visualizing it in Power BI or Tableau, check this blog post and pass by the Atlassian Marketplace to find the solution best suits you. Especially the connectors Appfire has: the Power BI Jira Connector for Cloud and Data Center, and the Tableau Connector Pro for Jira Cloud and Data Center that allows you to extract information from Projectrak project data and transform it into smart decisions for your organization based on Power BI or Tableau analytics. If you have any further questions, please contact us.


No Comments Yet
Let us know what you think